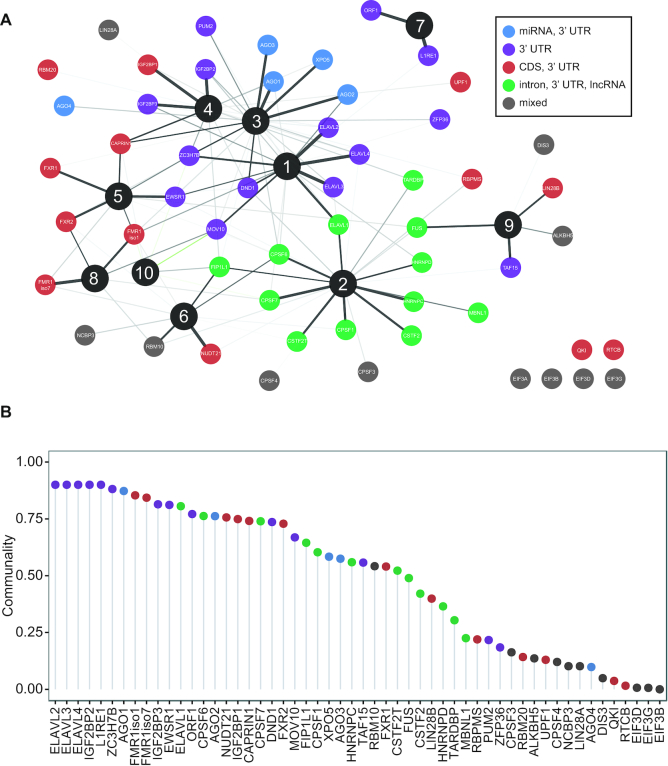
Figure 3.
RNA regulatory modules. (A) Factor analysis of target RNA encoding genes binding normalized by the reference library and expression for the 55 RBPs binding to mRNAs and lncRNAs for 13 299 genes (see ‘factor analysis’ section in methods for details). Spring-embedded graph of the factor loading matrix, indicating the association between each of the 55 RBPs and one of the 10 factors. Nodes color-coded by RNA annotation category preference cluster membership from Figure 1. Edge width scales with factor loadings (thicker edge = higher factor loading = stronger association). Only edges with a factor loading > 0.2 (positive values in black) or <−0.2 (negative values in green) depicted. (B) Dot plot of the communality, or the variance in a given RBP cumulatively explained by the all factors color-coded by RNA annotation category preference.

