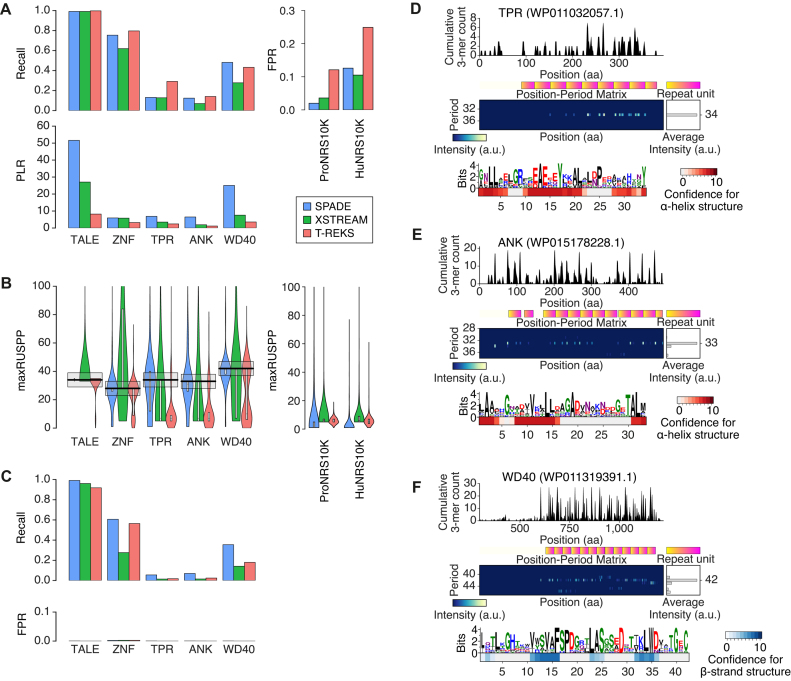
Figure 5.
Comparison of the performance of SPADE, XSTREAM, and T-REKS to detect tandem degenerate protein repeats. (A) Recalls, false positive rates (FPRs), and positive likelihood ratios (PLRs) of SPADE, XSTREAM, and T-REKS in capturing TALEs, ZNFs, TPRs, ANK repeats, and WD40 repeats. (B) Distribution of maximum repeat unit sizes per protein (maxRUSPPs) detected by each software for each protein family. Each bold black bar and each gray box denote the reported typical repeat unit size for the corresponding protein category and the ±5 aa range from the reported repeat unit size, respectively. (C) Recalls and FPRs of the different software after filtering maxRUSPPs of the detected positives to be within ±5 aa from the expected repeat unit size. From the maxRUSPP distributions of ProNRS10K (negative control for prokaryotic protein repeat families) and HuNRS10K (negative control for ZNFs), FPRs for different protein repeats of different expected repeat unit sizes were estimated. (D–F) Example protein repeats detected by SPADE for TPR (D), ANK repeat (E), and WD40 repeat (F). The heat map under each repeat motif sequence logo represents the confidence scores for α-helical structure (red heat map) or β-sheet structure (blue heat map) at each amino acid residue position.

