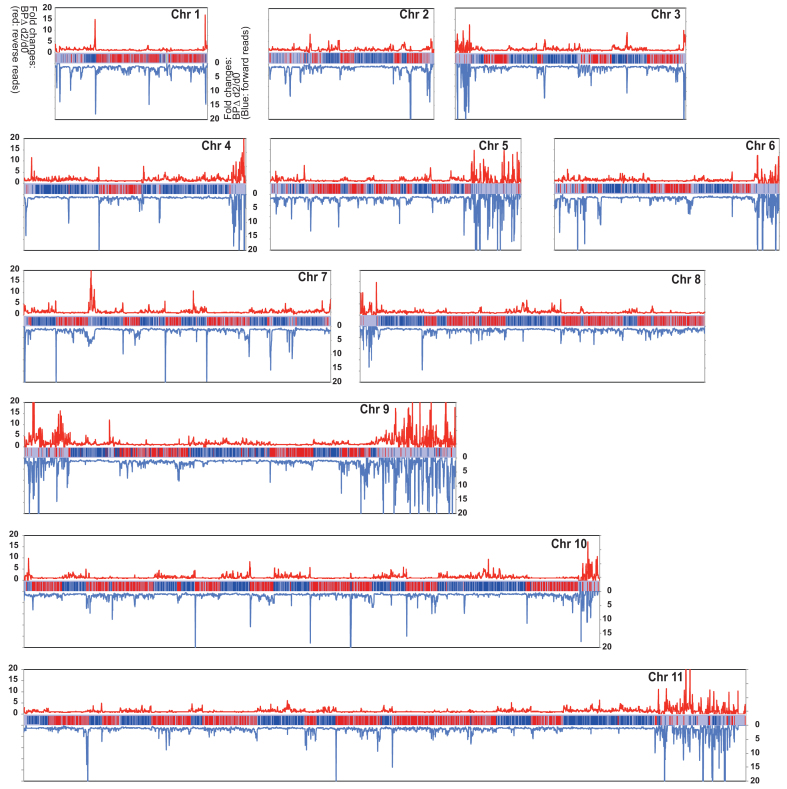
Figure 4.
TbMCM-BP deficiency accumulates antisense transcripts at PTU borders. Fold changes comparing transcription levels between day 0 and day 2 after TbMCM-BP deletion were calculated and plotted over the chromosome length. Reverse and forward reads were analyzed separately. Red lines indicate fold changes from reverse reads (mapping to forward strand, red PTUs) and blue lines indicate fold changes from forward reads (mapping to reverse strands, blue PTUs). Chromosome diagrams are shown in the middle of each graph.

