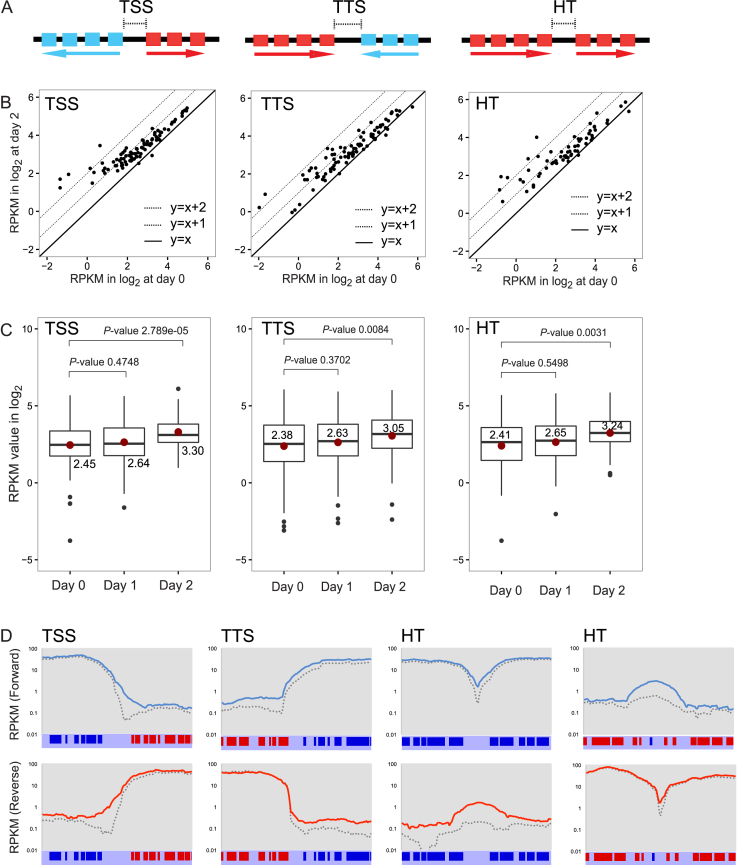
Figure 5.
TbMCM-BP affects transcription initiation and termination, and direction of transcription. Levels of transcripts at TSSs, TTSs, and HTs increased in TbMCM-BP mutant. (A) Diagrams of a TSS, a TTS, and a HT: boxes are genes in the PTUs and arrow indicates PTUs and transcription direction. (B) Scatter plots comparing levels of transcripts between day 0 and day 2 after TbMCM-BP depletion. Each dot represents a transcription boundary. Dotted lines are changes that are 2-fold or 4-fold up. (C) Box plots compare levels of transcripts from TSSs, TTSs, and HTs at day 0, 1, and 2 after TbMCM-BP deletion. Median values are shown and indicated as red dots. Black dots are outliers. Differences between day 0 and day 1 (day 0 and day 2) were measured by a Mann-Whitney U statistical test (Supplementary Table S2). (D) The region encompassing 15 kb upstream and downstream from a midpoint of a representative TSS (or a TTS or two HTs) was binned at 5 kb resolution with 0.2 kb step. RPKM values of forward or reverse reads mapping to each bin were calculated and plotted over the 30 kb length. Blue lines are forward reads and red are reverse reads from day 2 samples and dotted lines are from day 0. PTUs and genes are shown.

