Figure 3.
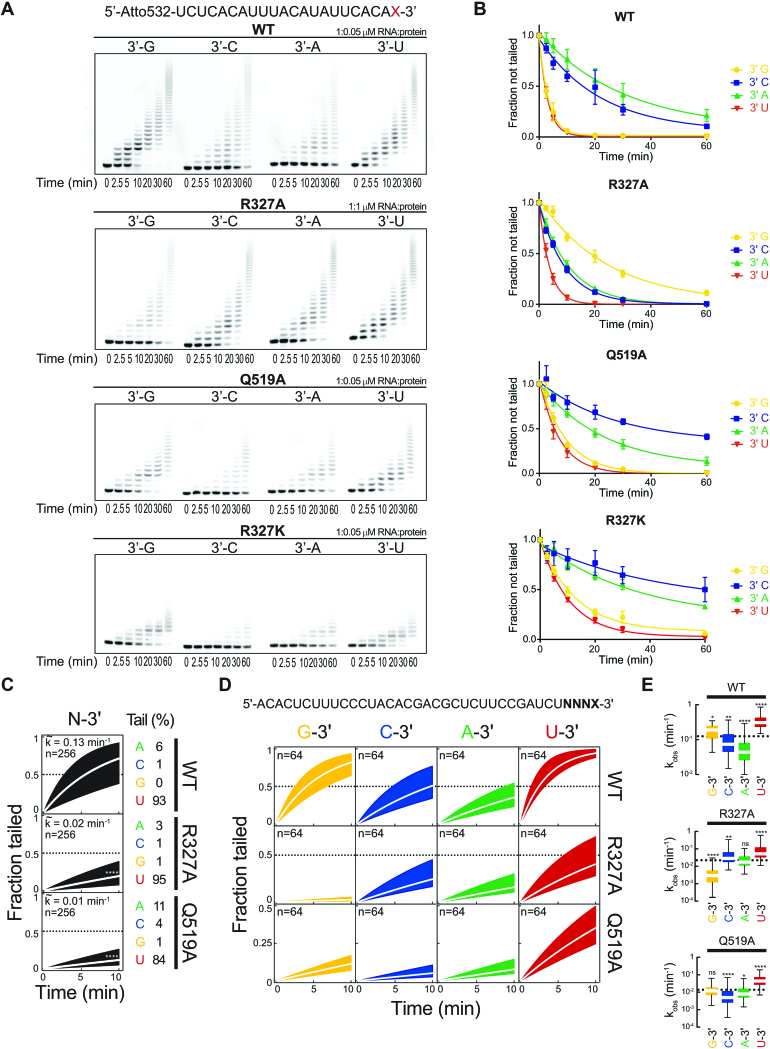
Active site arginine is responsible for substrate specificity of DmTailor. (A) In vitro uridylation assay with WT DmTailor180–560 and the R327A, Q519A, and R327K mutants. Four fluorophore-labeled 22-nt RNA substrates differing only in the terminal nucleotide were used, as indicated. Reaction products were resolved by denaturing polyacrylamide gel electrophoresis and visualized by fluorescence scanning. Representative gels of three replicates are shown. (B) Densitometric quantification of three replicates of the uridylation assay in (A). Data were fitted with an exponential one-phase decay equation in GraphPad Prism6. Error bars indicate standard error of the mean (s.e.m.) (C–E) High-throughput sequencing assay of WT DmTailor180–560 and the R327A and Q519A mutants. (C) Fraction tailed for all substrates (n = 256) over time (0, 2, 5 and 10 min) for WT DmTailor180–560 (top), R327A (middle) and Q519A (bottom) mutants. The median observed tailing rate (kobs, white line) and inner quartile range (black area) are shown. The nucleotide composition (%) of the tail at the end of the reaction is indicated. P-Value was determined by Mann–Whitney test relative to WT (****P < 0.001). (D) Fraction tailed for all substrates ending in 3′ G, C, A and U (n = 64) over time (0, 2, 5 and 10 min) for WT DmTailor180–560 (top), the R327A (middle) and Q519A (bottom) mutants. The median (white line) and inner quartile range (colored area) are shown. (E) Tukey box plot showing the observed tailing rates (kobs) grouped according to terminal nucleotide identity (n = 64; outliers omitted). The median kobs for all 256 substrates is represented as a dotted line. P-value was determined by Mann–Whitney test relative to all substrates (*P < 0.05, **P < 0.01, ****P < 0.001, ns non-significant).

