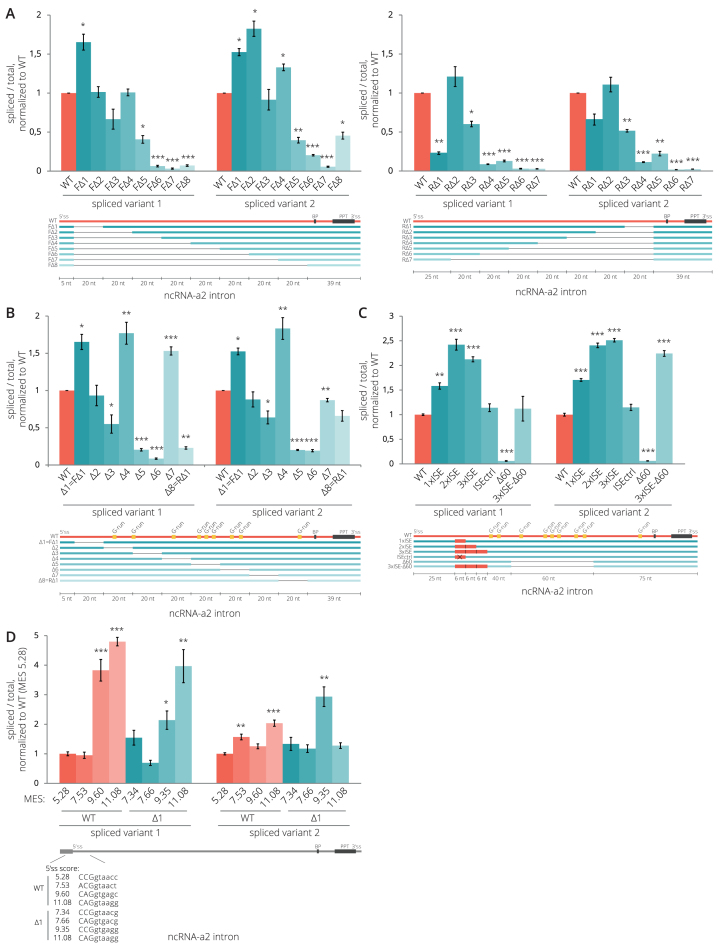
Figure 2.
Intronic splicing regulatory elements of ncRNA-a2. (A, B) Splicing efficiencies of ncRNA-a2 intron deletion mutants. Deletion of sequences in the center of the intron (mutants Δ5 and Δ6 in (B)) reduces ncRNA-a2 splicing. (C) Insertion of active ISEs (1–3) enhanced splicing while removal of the G-rich splicing enhancer sequence completely abolished splicing (Δ60 mutant). Splicing of the Δ60 mutant was rescued by insertion of 3xISE downstream of 5′ss. A splicing enhancer containing two inactivating point mutations was used as a negative control (ISEctrl). (D) Mutations strengthening the 5′ss improved splicing efficiency of WT as well as Δ1 mutant lacking a putative splicing inhibitory sequence. (A–D) Splicing efficiencies were measured as a fraction of spliced transcripts relative to the total amount of transcripts. Schemes under the charts indicate modifications of the intron sequence of ncRNA-a2 gene. Predicted branch point (BP), the PPT (black), G-run motifs (yellow) and artificial ISEs (red) are indicated. Sequences of all deletion constructs are shown in Supplementary Data. Bar plots show relative RNA levels as determined by RT-qPCR. The mean of at least three independent experiments is shown. Error bars indicate SEM; asterisks indicate the statistical significance levels calculated by two-tailed Student's t-test comparing the individual mutant with WT, *P < 0.05, **P < 0.01, ***P < 0.001.

