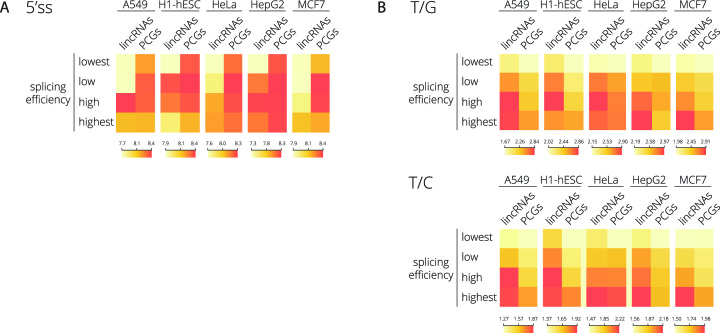
Figure 3.
LincRNA splicing efficiency correlates with the strength of 5′ss and PPT. LincRNAs and PCGs were divided into four groups based on their splicing efficiency containing an equal number of transcripts. (A) 5′ss strength or (B) thymidines over guanines (T/G) and thymidines over cytosines (T/C) ratios frequencies in the PPT region was calculated for lincRNAs and PCGs in different cell lines. The color schemes representing the distribution of data are shown under the heat maps. See also Supplementary Figures S5–S8 for further analyses.

