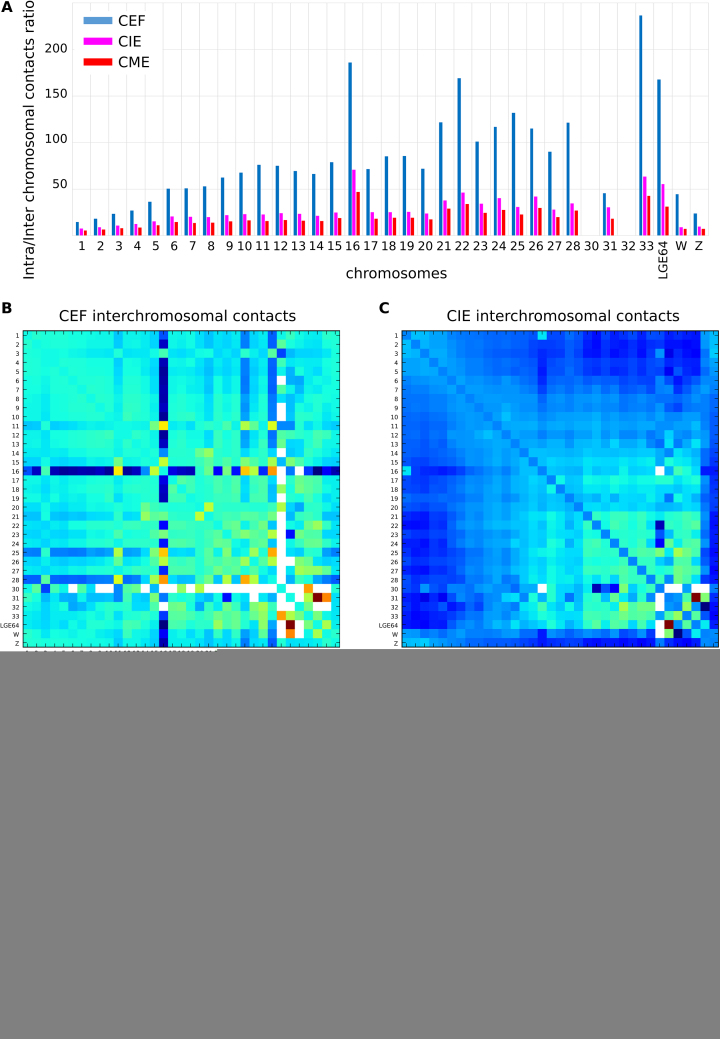
Figure 10.
Interchromosomal contacts in CEF, CIE and CME. (A) The ratio between intra- and interchromosomal contact numbers for CEF (blue), CIE (magenta) and CME (red). Note that it was not enough data to calculate the ratio for chromosomes 30 and 32. (B–D) The 2D heatmaps show the observed number of interactions between any pair of chromosomes divided by the expected number of interactions between those chromosomes in log2 scale for CEF (B), CIE (C) and CME (D). The color of each dot represents the enrichment (red) or depletion (blue) of contacts compared with the expected values.

