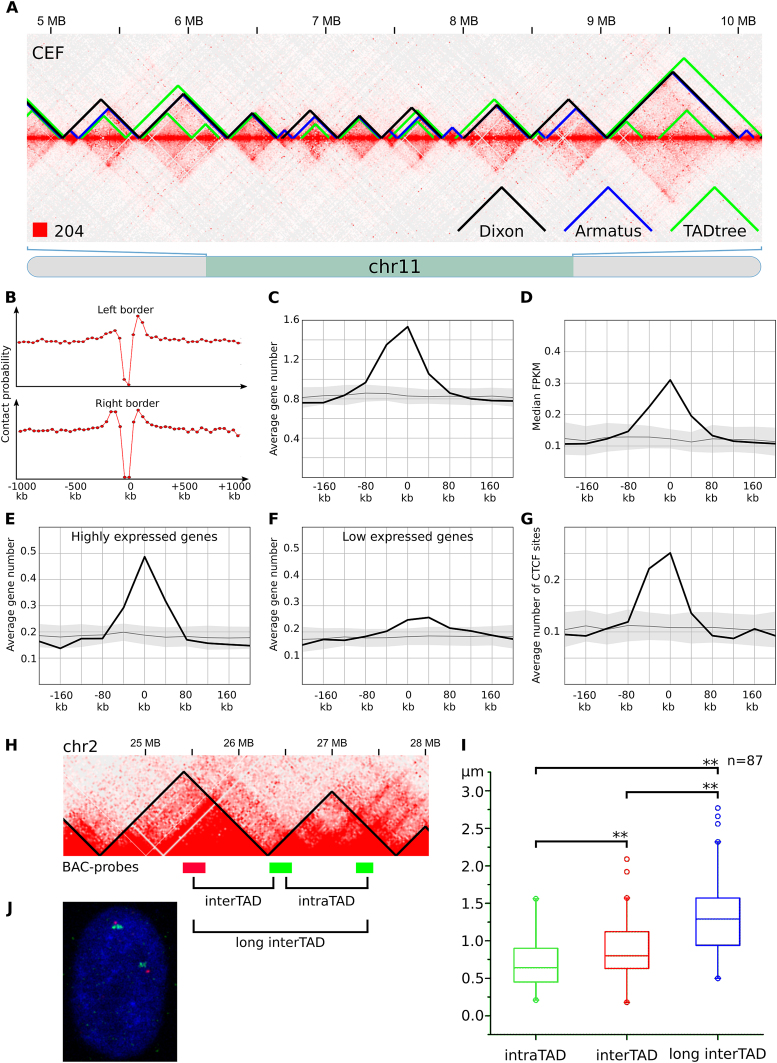
Figure 3.
TADs identified in chicken fibroblasts. (A) The fragment of the CEF heatmap displays the representative examples of TADs identified by Dixon, Armatus and TADtree algorithms. (B) The drop of contact probability between the genomic loci separated by the Dixon TAD border. The X-axis shows a distance from the border of a domain. The Y-axis represents average value of contact frequencies of pairs of loci located 40 kb upstream and 40 kb downstream of the point defined by X-axis values. An obvious drop of contact frequencies at the point 0 means reduced number of contacts between pair of loci located 40 kb away from a domain border: one locus is within the domain and another is outside of the domain. (C–G) Distribution of genomic features in relation to the Dixon TAD borders. X-axis represents a distance from the border of a domain as on A, the Y-axis shows the average number of features (or median value of feature on C) in a 40 kb interval centered according to the X-axis value. Black line and gray area represent average value and three standard deviations obtained by at least 100 permutations of Dixon TADs. Features depicted on C-G include genes (C); gene expression, represented as FPKM values (D); highly expressed (top 25% based on FPKM values) genes (E); low expressed (bottom 25%) genes (F); CTCF sites (G). (H) Scheme of the ∼3 MB region from chicken chromosome 2, containing two consecutive Dixon TADs. BAC-probes, labeled by different colors are located in neighboring TADs. Note that BAC-clones are equidistant (∼700 kb) from each other in the linear genome. (I) Distribution of distances between BAC-probes after FISH, shown as boxplots with outliers. Distances between probes were compared pairwise using paired sample Wilcoxon signed rank test. Significant differences are labeled ** when P ≤ 0.01. (J) Representative image after two-color FISH with TAD-specific BAC-probes in CEF nucleus.

