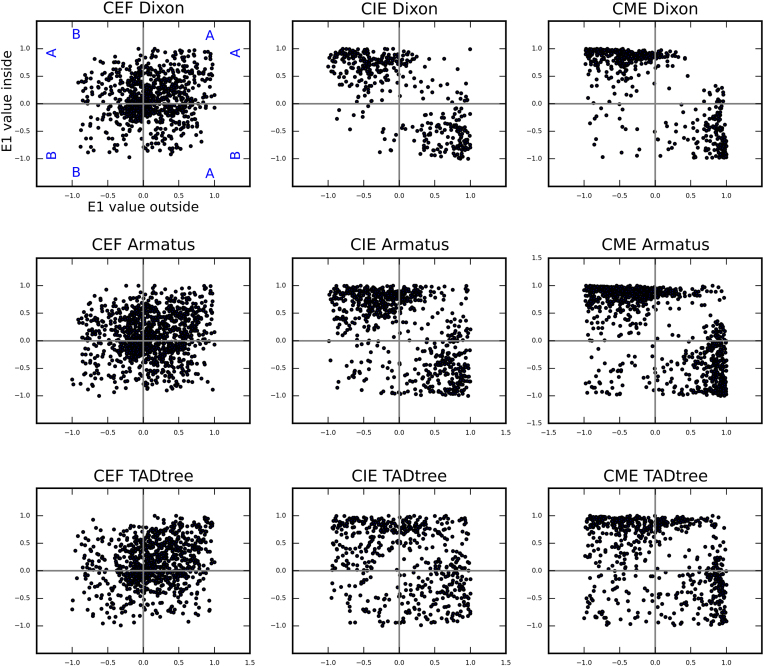
Figure 5.
TAD borders identified in CME represent transition between compartments. Each dot represents single TAD border, and located on the scatterplot according to the E1-values of two loci separated by this border: the E1-value for loci outside TAD (X-axis) and inside TAD (Y-axis). We consider TAD border only if the border displays stronger insulation than average loci in genome, i.e. contacts frequency between two loci separated by this border was less than genome-wide average – 1*SD.

