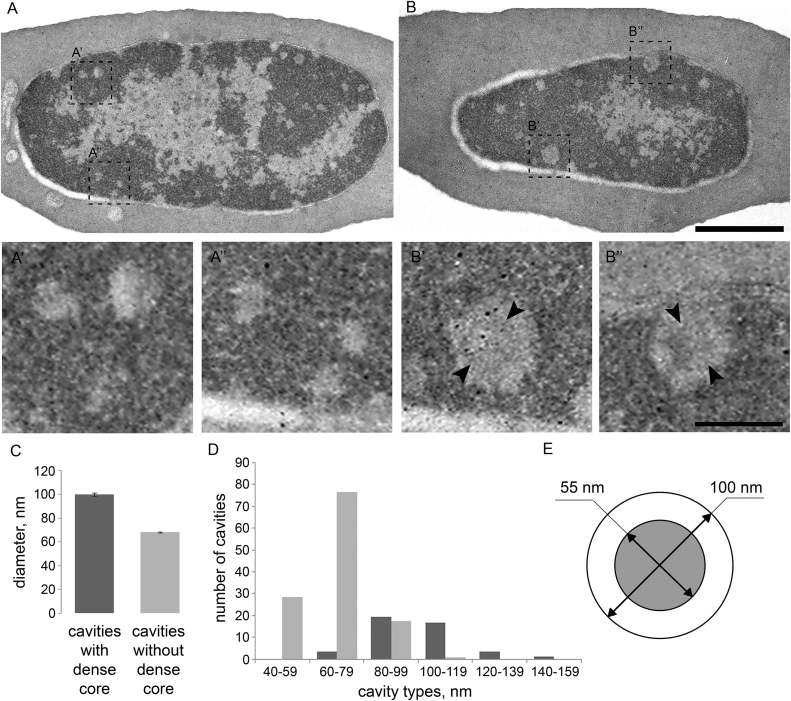
Figure 7.
Transmission electron microscopy analysis of chromatin organization in erythrocytes. (A and B) Different sections of the same erythrocyte, showing large regions of heterochromatin with peripheral localization. Note the small round-shape cavities in the heterochromatin without (A’’, B’) or with (A’, B’’) a dense core. (C) Mean diameter of the cavities with or without the dense core quantified on 18 serial sections of four cells. (D) The abundance of cavities of different diameter with or without the dense core. (E) Scheme of cavity with the dense core showing mean diameter of the cavity and the core (55 nm). Scale bar: 1uM (A, B), 100nm (A',A'',B',B'')

