Figure 8.
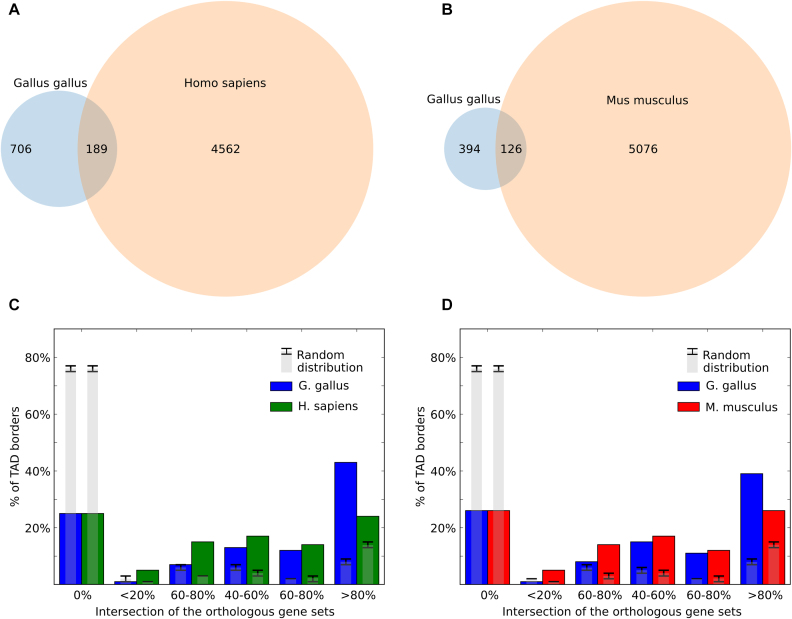
Evolutionary conservation of TAD borders. (A and B) The overlap of chicken and human (A) or chicken and mouse (B) Dixon TAD boundaries in syntenic regions. (C and D) The similarity of orthologs near Dixon TAD borders. All TAD borders were classified into six categories depending on the gene synteny level near the border. For example, if six genes are located near a given chicken TAD border, and five orthologs of these genes are jointly located near any TAD border in human genome, the intersection between sets will be 0.83 (83%) and the chicken TAD border will be classified as highly conserved (category >80% similarity). Gray bars indicate values obtained at random, with error bars showing three standard deviations.

