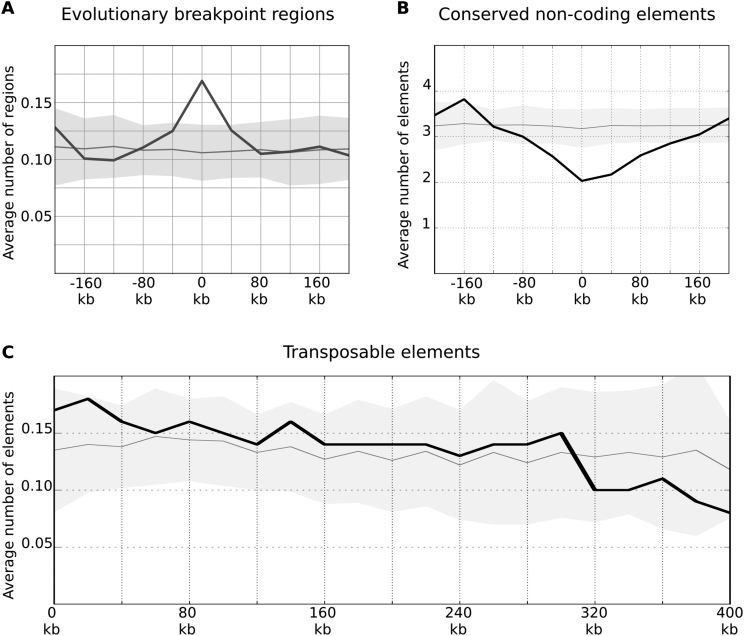
Figure 9.
TAD borders are hotspots of avian evolutionary breakpoints. (A and B) The distribution of evolutionary breakpoint regions (excluding galliform linage specific EBRs) and conserved non-coding elements is shown as on Figure 3C. The X-axis represents a distance from the border of a domain. (C) The distribution of transposable elements relative to domain borders is shown as on Figure 3C, the negative and positive distances on the X-axis are averaged and the X-axis is extended to 400 kb to show decline of the curve.

