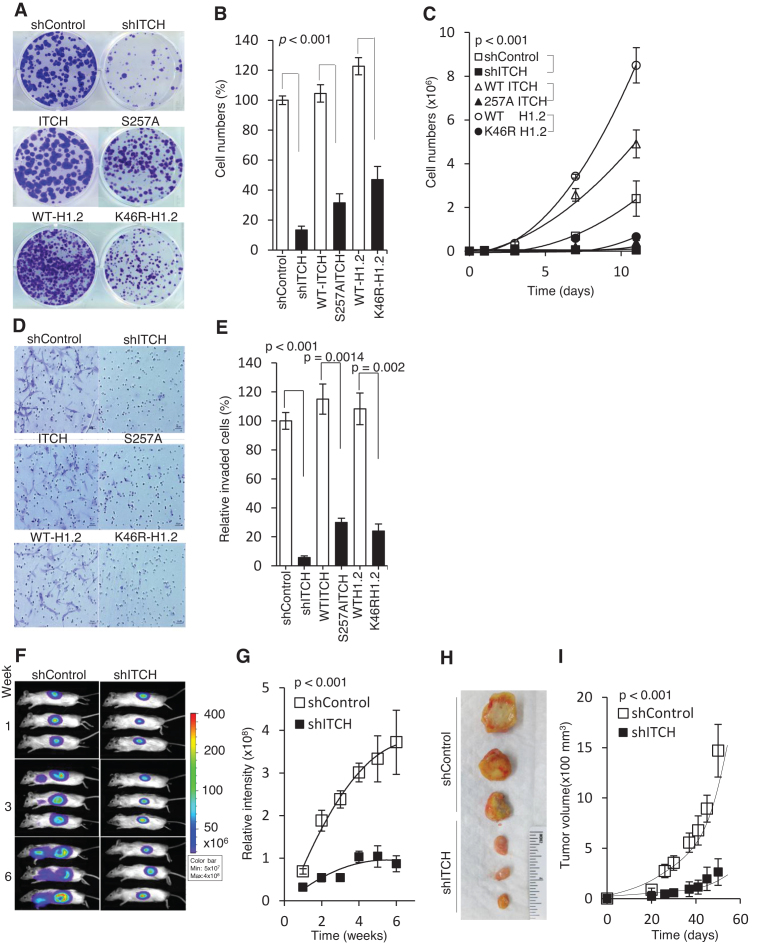
Figure 8.
Disruption of the ITCH-H1.2 pathway limits cell growth and migration in MDA-MB-231 cells. (A) Representative image (N = 3) of clonogenic assay of MDA-MB-231 cells stably expressing shITCH or shControl; GFP-tagged WT ITCH, S257A ITCH; H1.2 shRNA knockdown reconstituted with GFP-tagged WT H1.2 or K46R H1.2. Cells were seeded at 500 cells. Colonies were fixed and stained with crystal violet two weeks later. (B) Quantitative measurement of clonogenic assays in (A) from triplicate experiments. (C) 500 cells from each group were plated in triplicate on day 0 and counted every 48 h. (D) Representative images of matrigel invasion assays performed in the above cell groups, stained with 0.5% methylene blue. (E) Quantitative measurement of invasive cells in (D). (F) Representative bioluminescence images of mice (N = 12) taken at the indicated times. Images show tumor growth following injection of shITCH or shControl MDA-MB-231 cells into the fourth mammary fat pad of NSG mice; (G) Quantitative analysis of tumor bioluminescence signals over time (n = 12). (H) Representative images of tumor growth in NSG mice (N = 12) at week 6 following xenograft; (I) Time course of tumor growth in NSG mice. P values compared between groups indicated with a bracket. Data represented as mean ± S.D.

