Figure 3.
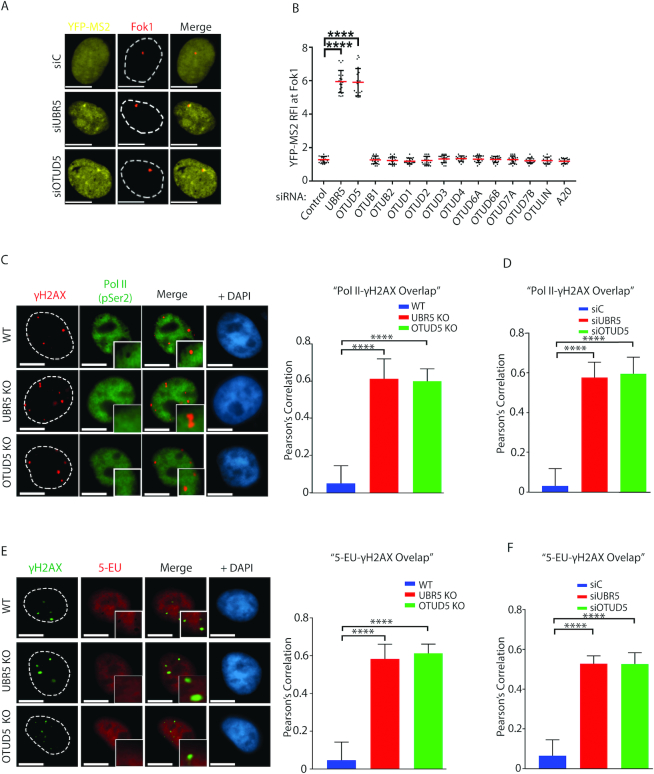
OTUD5 regulates transcription repression at damaged chromatin. (A) Ptuner 263 cells transfected with indicated siRNAs were treated with Shield-1/4-OHT and Tetracyclin for inducing LacI-mCherry-Fok1 fusion nuclease and YFP-MS2 reporter, respectively, 3 hours prior to fixing. The representative images are shown. (B) As in A, the assays were performed with indicated siRNAs and the YFP-MS2 RFI at Fok1 sites were quantified and plotted. See ‘Materials and Methods’ section for RFI description. The assay was performed in triplicates (N = 35 each, **** indicates P-value < 0.0005). Scale bars indicate 10 μm. For C and E, the UBR5 and OTUD5 CRISPR KO HeLa cells were treated with Bleomycin (5 µM) for 16 hours, fixed, then co-stained with γH2AX and Pol II P-Ser2 (C), or γH2AX and 5-EU (E). On the right are the quantification of the γH2AX overlap with Pol II (P-Ser) or 5-EU in WT and KO cells. The Pearson’s correlation was measured using the ‘co-localization’ finder plug-in in Image J. The assay was performed in triplicates (N = 50 each). A score of ‘1’ indicates 100% correlation between red and green pixels; a score of ‘−1’ indicates inverse correlation. ‘0’ indicates no relationship. Similar experiments were done using siRNA transfected cells for the PolII-γH2AX overlap analysis (D) and the 5EU-γH2AX overlap analysis (F). Representative images for these assays are shown in Supplementary Figures S11 and 12, respectively). All analysis were done in triplicates. (**** indicates P-value < 0.0005).

