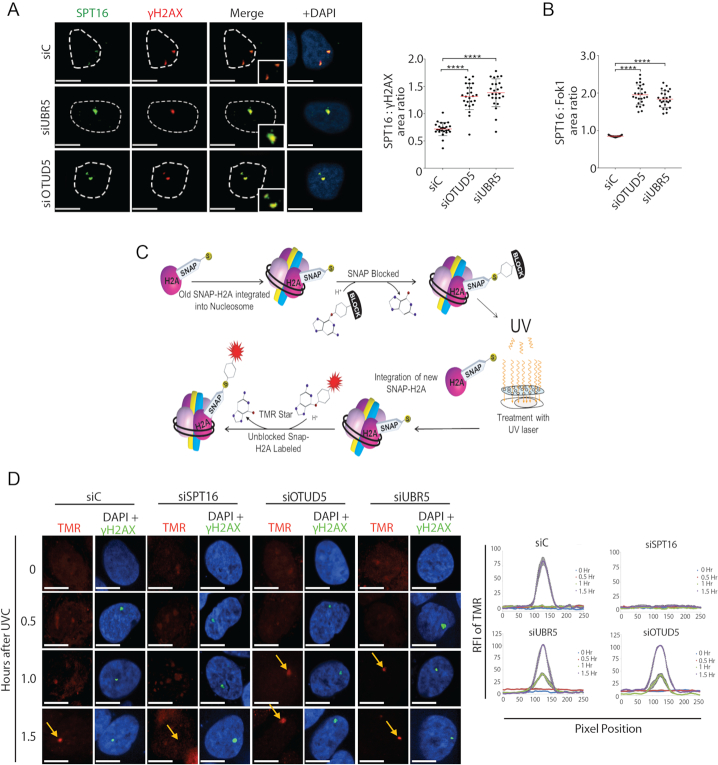
Figure 5.
OTUD5 and UBR5 regulates the deposition of new Histone H2A at the damage sites. (A) Enlargement of SPT16 foci in UBR5 and OTUD5 knockdown cells. HeLa cells were irradiated with UVC (100 J/m2) through 3 μm micropore filters and fixed 1 hour after. The number of pixels in each γH2AX and SPT16 co-localized foci was measured using Image J, with each pixel represents an area of 0.2 μm2. The ratio of SPT16 to γH2AX was calculated by dividing the SPT16 area by the γH2AX area. The assay was performed in triplicates (N = 35). Red bars indicate the median value for each set. (B) Ratio of SPT16 to Fok1 area in pTuner263 cells transfected with the siRNAs were quantified as in (A) The assay was performed in triplicates, N = 25. (C) Schematic for SNAP-H2A labeling and nucleosome integration. (D) U2OS cells stably expressing SNAP-H2A were first blocked with TMR Block and then irradiated with UVC (100 J/m2) through 3 μm micropore filters. Cells were labeled with TMR Star (red) and then fixed at indicated time points. Cells were counter-stained for γH2AX. The assay was performed in triplicates. Vector quantification of RFI of TMR signal (SNAP-H2A) (N = 20); see ‘Materials and Methods’ section for details. Scale bars indicate 10 μm. (**** indicates P-value < 0.0005).

