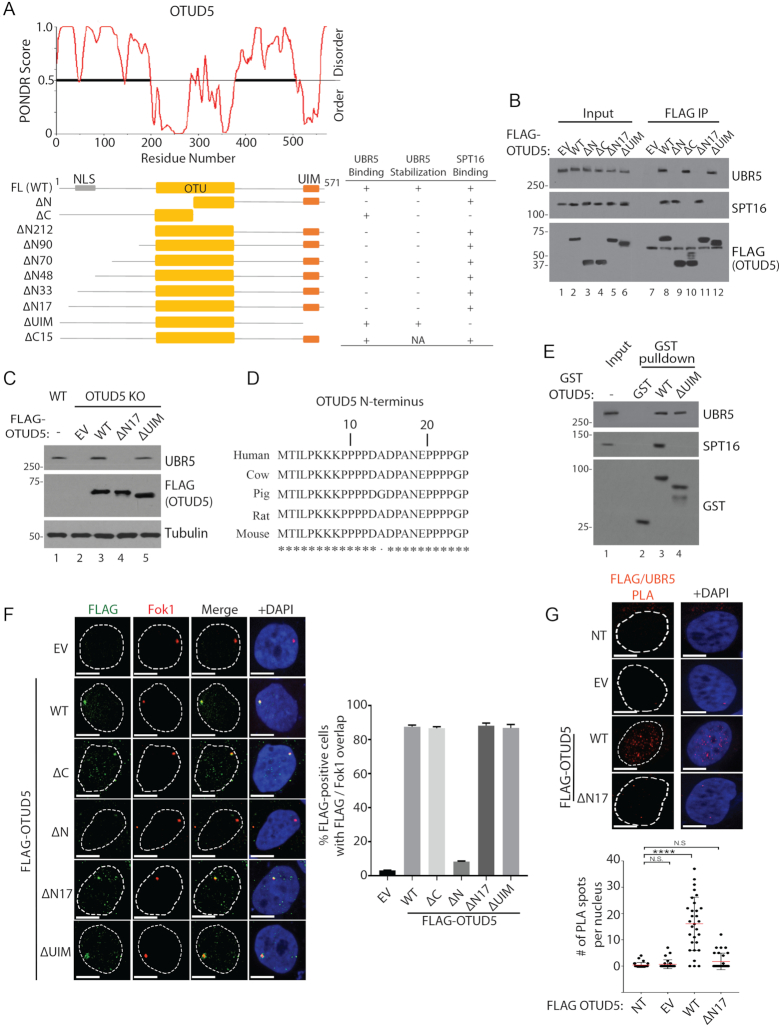
Figure 6.
OTUD5 interacts with UBR5 and SPT16 through distinct regions. (A) PONDR software predicts the disordered regions within OTUD5 protein. Below is a schematic for the OTUD5 truncation plasmids used for interaction and other functional analyses. The summary of the assay results are shown on the right: ‘Binding’ was measured by co-IP assays as shown in (B), and ‘Stabilization’ was measured by western blots as shown in (C). ‘NLS’ is indicated on the schematics based on our analysis in Supplementary Figure S20. (B) 293T cells transfected with the indicated plasmids, then anti-FLAG IP was performed and the eluates were analyzed by western blotting (C). HeLa OTUD5 KO (clone#2) cells were transfected with indicated plasmids and UBR5 protein was analyzed. (D) Cross-species alignment on the N-terminus of OTUD5. (E) Purified WT or ΔUIM GST-OTUD5 recombinant proteins was mixed with 293T cell lysate, pulled down with glutathione beads, then the eluates were analyzed by western blots. (F) Ptuner263 cells were transfected with indicated OTUD5 truncates (EV = empty vector) then the Fok1 nucleases were induced by Shield1 and 4-OHT. Cells were fixed then stained with anti-FLAG antibody. The experiments were done in triplicates and on the right is the statistical information (N = 30 each). (G) HeLa cells were transfected with indicated pBABE-FLAG-OTUD5 plasmids (NT = non transfected, EV = empty vector) and the PLA assay with anti-UBR5 and anti-FLAG (OTUD5) was performed (N = 30). Scale bars indicate 10 μm. (**** indicates P-value < 0.0005, N.S. = not significant).

