
Figure 6.
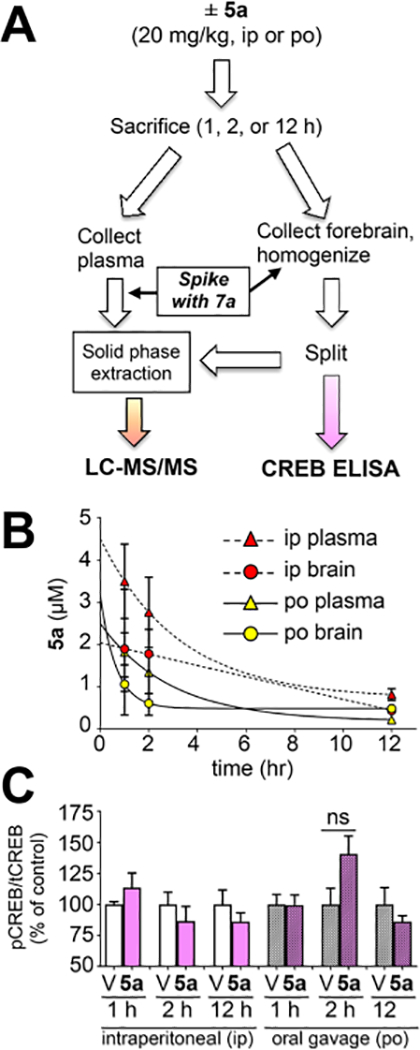
(A) Male C57BL/6 mice (N = 4 per cohort) were treated with vehicle or 5a (20 mg/kg), and at the specified time, plasma and forebrain were collected and processed as indicated. (B) At the specified time (1, 2, or 12 h), plasma (triangles) and forebrain (circles) were collected, spiked with 7a, and extracted. Oral gavage (po) is indicated by solid lines and yellow symbols. Intraperitoneal injection (ip) is indicated by dotted lines and red symbols. Quantitation based on the ratio of the AUC of the MRM transitions for 5a versus 7a relative to a calibration curve. Concentrations (μM) were calculated after normalizing for tissue weight (assuming tissue/plasma density =1). Data shown as mean ± SEM (n = 4) for all cohorts except 1 h ip (n = 3), see exclusion criteria in Experimental Section. (C) Forebrains were homogenized, normalized by bradford, and analyzed for pCREB and tCREB by ELISA (V = veh, D = drug [5a]). The ratio of absorbance values was normalized to Veh mean = 1 for each treatment group. Data represent mean ± SEM (n = 4), analysis by one-way ANOVA with Tukey’s test.