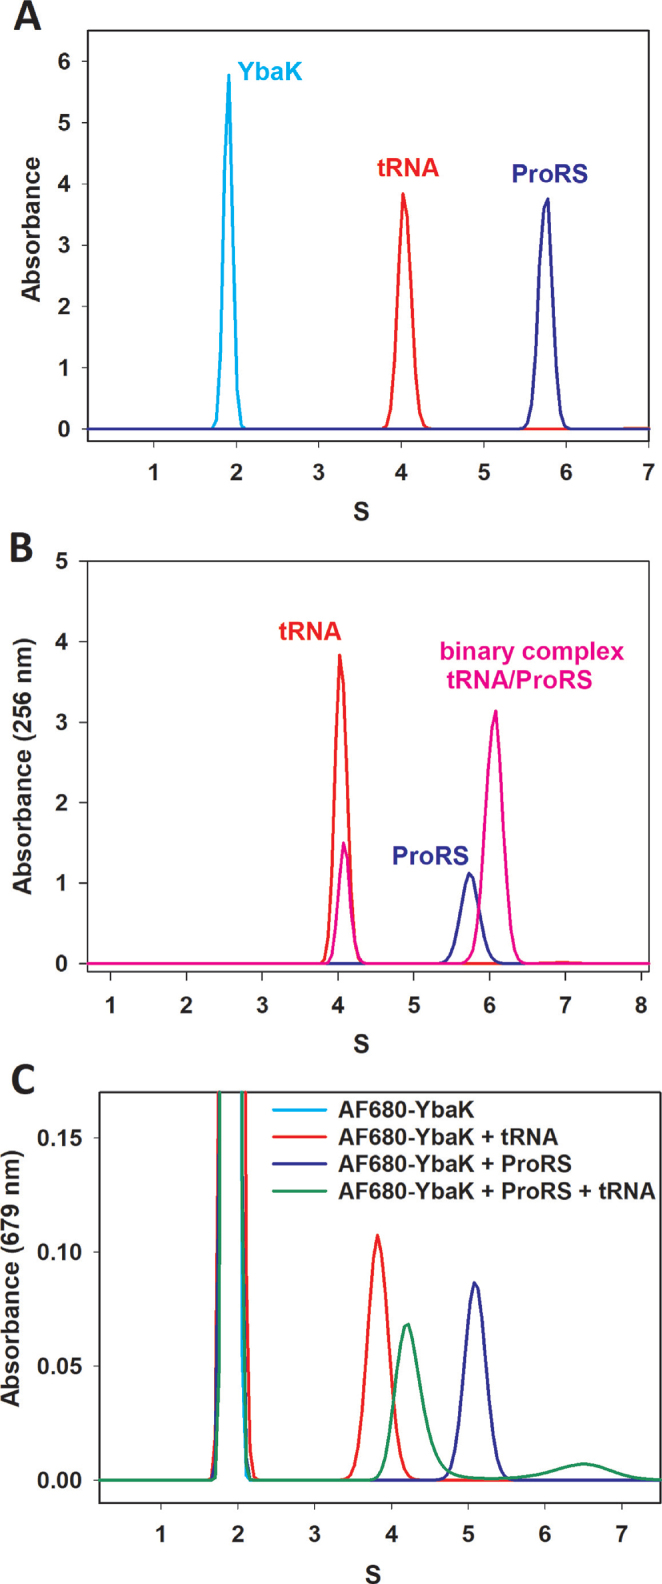
Figure 2.
Sedimentation coefficient distribution of C. crescentus ProRS, C. crescentus YbaK, E. coli tRNAPro and their complexes. (A) AUC results of individual species. ProRS (blue) absorbance at 280 nM, AF680-YbaK (cyan) absorbance at 679 nM, and tRNAPro (red) absorbance at 256 nM. (B) ProRS alone (blue), tRNAPro (red), and ProRS mixed with tRNAPro (pink). (C) AF680-YbaK (cyan), AF680-YbaK mixed with ProRS (blue), AF680-YbaK mixed with tRNAPro (red) and AF680-YbaK mixed with ProRS and tRNAPro (green).

