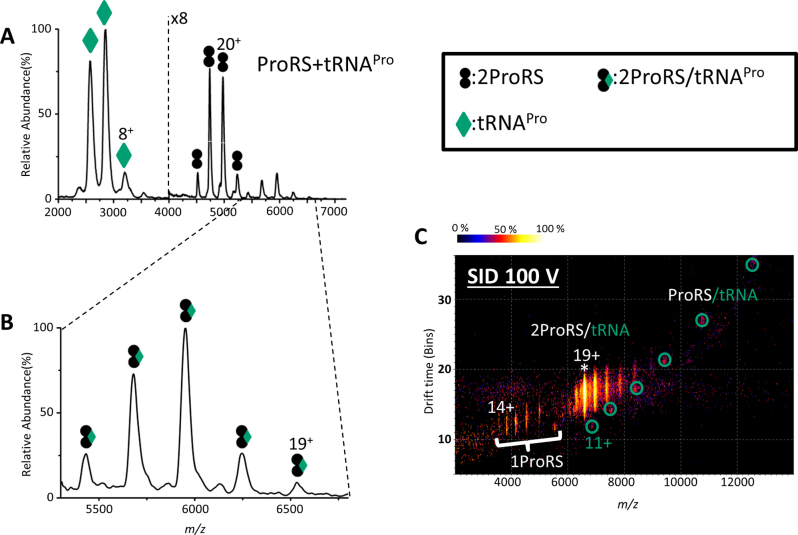
Figure 3.
Native mass spectra and ion mobiligram of the binary complex of ProRS/tRNAPro. (A) Mass spectrum of a mixture of ProRS and tRNAPro. (B) Zoom in of the high m/z region (5300–6800 m/z) of (A) showing the complex of two ProRS with one tRNAPro; the observed mass of the binary complex is 124.5 kDa whereas the theoretical mass is 123.8 kDa. (C) Ion mobiligram illustrating products after SID (100 V; 1900 eV) of the binary complex. * represents the precursor peak that was isolated for SID (adjacent peaks are from charge stripping and reflect different charged states). ProRS monomer peaks are indicated and ProRS/tRNA complex peaks are circled.

