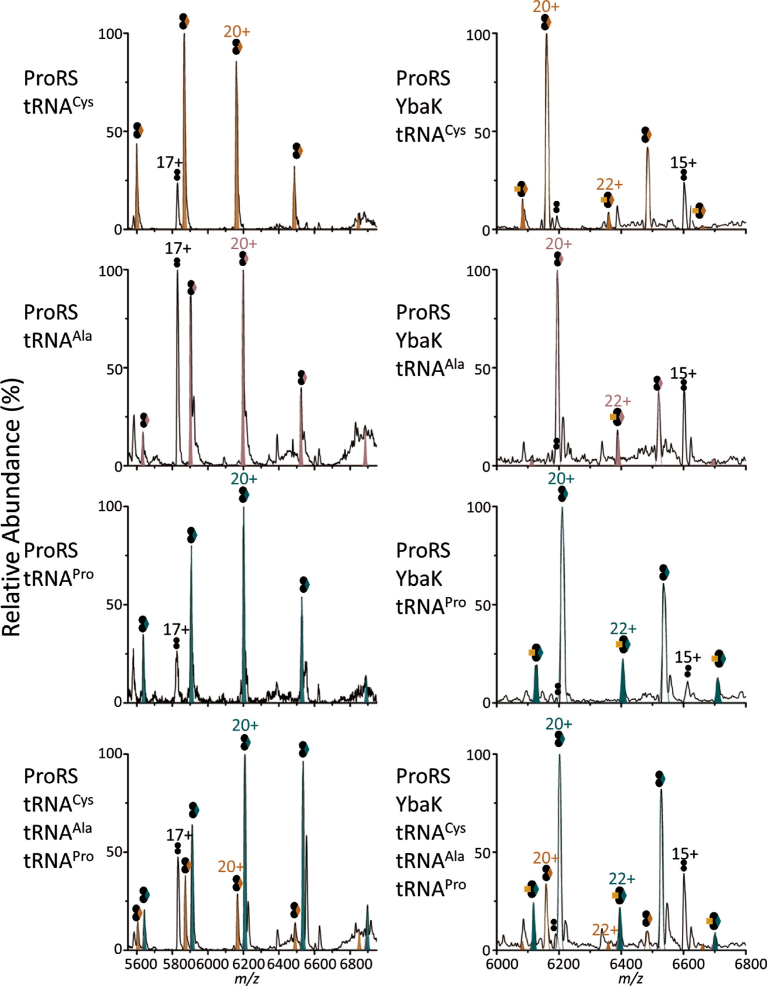
Figure 7.
Competition studies of ProRS, and ProRS/YbaK with different tRNAs. Left: Native mass spectra of ProRS with individual tRNAs and a mixture of tRNAPro, tRNAAla and tRNACys. Gaussian simulation plots for complexes of ProRS/ tRNAcys (orange), tRNAala (pink), and tRNAPro (green) are filled in and overlaid on the experimental data (black) Right: Native MS of ProRS and YbaK with individual tRNAs and a mixture of tRNAPro, tRNAAla, and tRNACys. Simulated peaks for ternary complexes with tRNACys (orange), tRNAAla (pink), and tRNAPro (green) are filled in, and plots for binary complexes of ProRS with tRNACys (orange), tRNAAla (pink), and tRNAPro (green) are shown in solid outline overlaid on the experimental data (black). Representations of symbols are indicated in Figure 5.

