Figure 3.
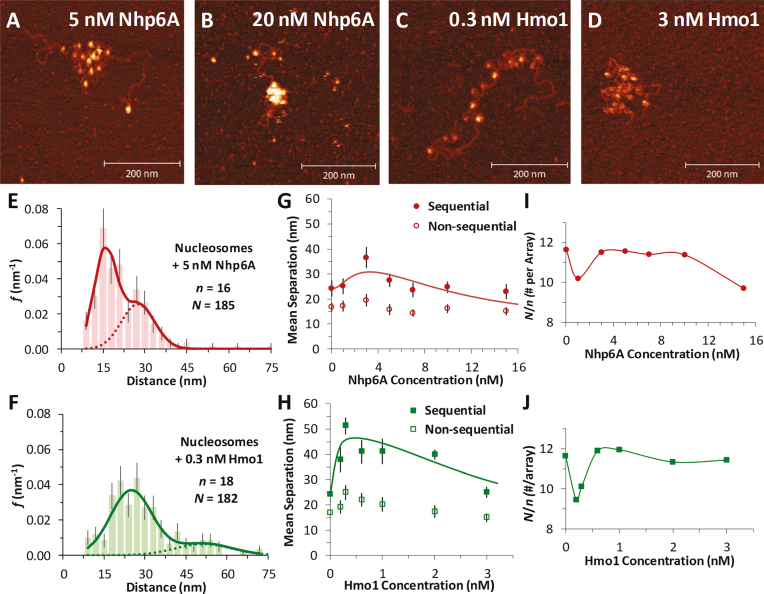
Nucleosome dispersion and compaction by HMGB proteins. (A, B) Images of reconstituted nucleosome arrays (∼0.1 nM) in solutions containing Nhp6A, with dispersion evident at 5 nM Nhp6A (A) and compaction at 20 nM Nhp6A (B). (C, D) Nucleosomes in solutions containing the 2- box HMGB protein Hmo1, showing nucleosome dispersion at 0.3 nM Hmo1 (C) and compaction at 3 nM Hmo1 (D). (E, F) Histogram of core particle separations in 5 nM Nhp6A (E) and in 0.3 nM Hmo1 (F) showing an increase in the measured distances, fit to the dual Gaussian model of Supplementary Equation S1. Complete sets across all protein concentrations are in Supplementary Figure S3 and S4. (G, H) Summary of measured lengths obtained from fits to the distance histograms, with uncertainties determined as described in Supplementary Methods 1. The longer distance regime is associated with sequential nucleosomes separated by linker DNA (solid symbols). Shorter distances correspond to non-sequential nucleosomes whose approach is not limited by the stiffness of short DNA segments (open symbols). As protein concentration increases, nucleosomes are observed to disperse, then compact at the highest concentrations. This is true for both Nhp6A (G) and Hmo1 (H), though the amount of protein required varies. The sequential data are fit to a dispersion/compaction model (solid line) described in Supplementary Methods 4. (I, J) The measured number of nucleosomes identified in each array (N/n), for a given concentration of Nhp6A (I) and Hmo1 (J). Protein concentrations associated with nucleosome disruption also see some nucleosome loss. Results from fits are found in Supplementary Table S1 and key parameters are shown in Table 1.

