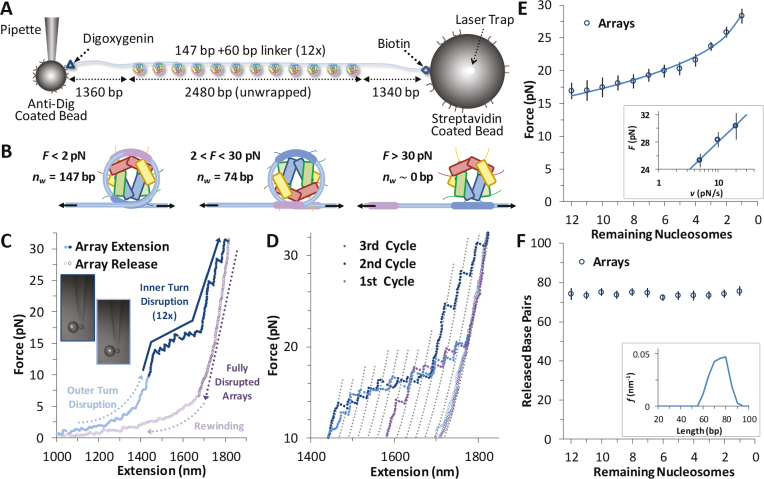
Figure 4.
Force disruption of nucleosomes. (A) Schematic for arrays in OT experiments. (B) In OT experiments at low forces (<10 pN) the outer turn is gradually unwrapped, as the interactions of the H2A–H2B dimers with the DNA are disrupted (this event is not visible in these experimental conditions). The inner turn is anchored by DNA-histone binding of the (H3–H4)2 tetramer. These DNA–protein interactions are disrupted at ∼20 pN and the entire length of released DNA is measured directly. (C) Data for cycles of increasing extension (solid symbols) and release (open symbols) for reconstituted 12-nucleosome array. Outer turns smoothly unwind below 10 pN (cyan), while 12 discrete inner turn disruption events are clear between 15 and 30 pN (blue). The remaining B-form DNA is slowly released (purple), and below 10 pN, some nucleosomes are observed to partially reform (violet). (D) Sequence of three extension/release cycles (cyan, blue, violet) show nucleosome rebinding does occur, though with decreasing frequency. Dotted grey lines represent disrupted intermediates, each separated by equal contour length changes as guides to the eye and corresponding to the release of the innermost loop (Δx ∼70 base pairs) from an individual nucleosome. (E) Average disruption force as a function of remaining nucleosome number in an array (A) is fit to Equation (1) (solid line). Inset plots release force of the final nucleosome in each array (A = 1) versus the loading rate, fit according to a dynamic force spectroscopy model (26,30). Parameters from both fits are summarized in Supplementary Table S2. (F) Direct measurement of each unwrapping length Δx as a function of the remaining number of nucleosomes in the array (A), corrected for DNA elasticity. Averaged across all nucleosomes, Δx = 74 ± 7 bp (Table 1). Inset shows the distributions of the released DNA for all N.

