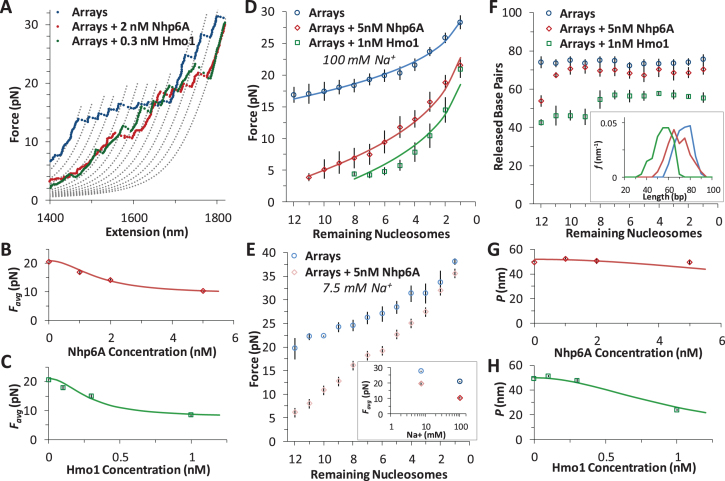
Figure 5.
HMGB proteins disrupt DNA-histone interactions. (A) Force extension of nucleosome arrays in the presence of 1 nM Hmo1 (green) and 5 nM Nhp6A (red), compared to arrays alone (blue). Polymer models are separated by a contour length change of 70 base pairs. (B, C) Average disruption force for each array in the presence of increasing concentrations of Nhp6A (B) and Hmo1 (C). Fits determine HMGB binding affinity to the nucleosome and are discussed in Supplementary Methods 5 while the results are shown in Supplementary Table S1 (key numbers also appear in Table 1). (D) Average disruption force as a function of remaining nucleosome number (A) is fit to Equation (1) (solid line) for arrays (blue circles) and arrays in 5 nM Nhp6A (red diamonds) and in 1 nM Hmo1 (green squares). Adding HMGB proteins reveals a definite decrease in the distance to the transition state (x†) and an increase in the natural (zero force) rate of unwinding (ko). Full results from fits to arrays (blue, χ2 ∼ 2), to arrays in 5 nM Nhp6A (red, χ2 ∼ 5), and arrays in 1 nM Hmo1 (green, χ2 ∼ 5) are summarized in Supplementary Table S2. (E) Average disruption force as a function of remaining nucleosome number (A) for arrays in low salt ([Na+] = 7.5 mM, in cyan) and for arrays in low salt and 5 nM Nhp6A (pink). Inset compares average disruption force with the values at high (100 mM) Na+. Arrays are more stable in low salt and are similarly destabilized by Nhp6A as discussed in Supplementary Methods 6. (F) Direct measurement of each unwrapping length Δx as a function of the remaining number of nucleosomes in the array (A) corrected for DNA elasticity, for nucleosomes (blue circles) and for nucleosomes in the presence of 1 nM Hmo1 (green squares) and 5 nM Nhp6A (red diamonds). Average values of Δx are shown in Table 1 (n > 9 arrays) though disruptions could not always be observed at low forces for each array. Inset shows distributions of the released DNA for all N. (G, H) Measured persistence length (P) of bare DNA in increasing concentrations of Nhp6A (G) and Hmo1 (H). Fits are described in Supplementary Methods 7, and show minimal binding to bare DNA, though nucleosome binding is saturated at these concentrations.

