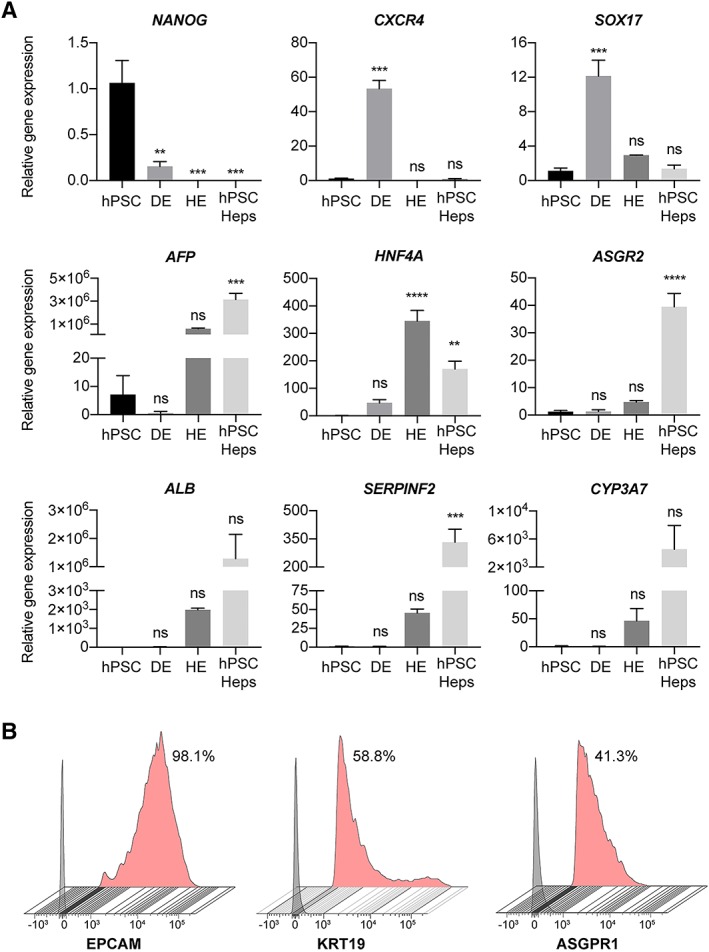
Figure 3.

Phenotypical characterization of hepatic differentiated cells. (A): Differential expression of selected genes reveals progressive maturation of human pluripotent stem cells (hPSCs) to definitive endoderm, hepatic endoderm and then hepatocytes (hPSC‐Heps). Expression relative to the housekeeping gene, and normalized against the average expression of hPSCs; n = 3 experiments, 1 cell line. Data are mean ± SEM, ordinary one‐way ANOVA followed by Dunnett post hoc test to compare the mean of each group to hPSC expression. **, p < .005; ***, p < .0005; ****, p < .0001; ns: nonsignificant. Data shown for cell line 1. (B): Flow cytometry analysis of surface marker expression on hPSC‐Heps at day 21 of differentiation. Data shows the percentage of positive cells from the live cell population. Gray histogram represents fluorescence minus one (FMO) control used to establish the gate, red histogram represents stained hPSC‐Heps. All flow cytometry analysis is representative of at least three independent experiments. Data shown for cell line 3.
