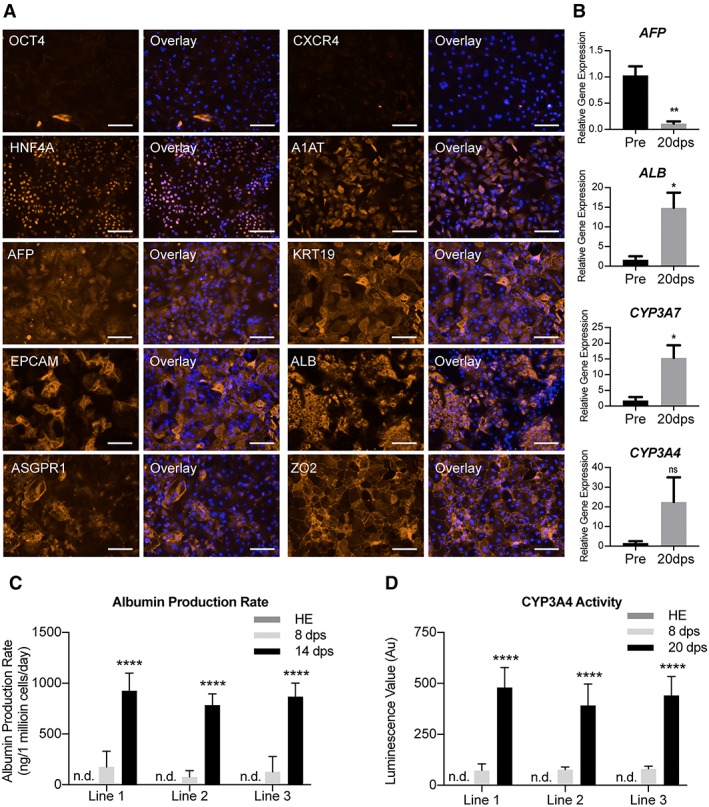
Figure 4.

Characterization of human pluripotent stem cells (hPSC)‐derived hepatocyte maturation in two‐dimensional (2D) model. (A): Immunofluorescent images revealing the transition of pluripotency (OCT4), endodermal (CXCR4), and hepatic specification (HNF4A, A1AT, AFP, KRT19, and EPCAM) and mature hepatic (ALB, ASGPR1, and ZO‐2) expression in hPSC‐Heps after 20 days postseeding on 2D model. Representative images selected from each of the three lines. Scale bar: 100 μm. (B): Differential gene expression showing the relative expression of four key hepatic genes (AFP, ALB, CYP3A7, and CYP3A4) in preseeding (pre) and 20 days postseeding (20 dps) into 2D model. Statistical significance determined by Student's t test (two‐tailed); n = 3 experiments. Data shown for cell line 1. Data are mean ± SEM, *, p < .05; **, p < .005; ns: nonsignificant. (C): Albumin production rate of hPSC‐derived hepatic endoderm (HE), and hPSC‐Heps 8 and 14 days postseeding (8 and 14 dps) into 2D model; n.d.: not detected; n = 6 experiments per cell line. Data are mean ± SD, ****, p < .0001. (D): Cytochrome P450 3A4 enzyme activity of hPSC‐derived HE, and hPSC‐Heps 8 and 20 days postseeding into 2D maturation culture, n.d.: not detected; n = 3 (mean luminescence value [n = 6] of 3 independent experiments). Data are mean ± SD, ****, p < .0001.
