Figure 1.

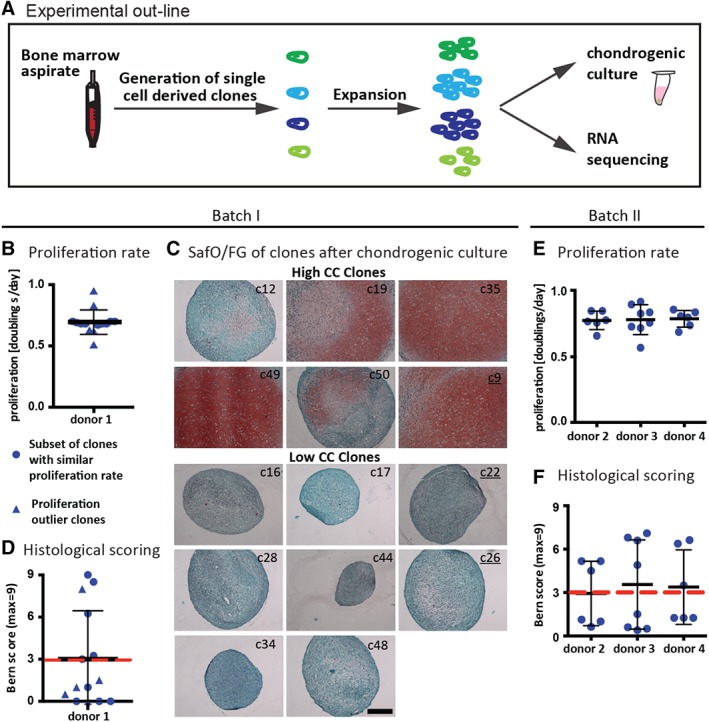
Chondrogenic capacity of single cell derived bone marrow derived mesenchymal stromal cell (BMSC) clones. (A): Fresh bone marrow aspirates were used to generate single‐cell derived clones of BMSCs. For each clone after expansion one part of the cells was subjected to chondrogenic in vitro culture and the other part to RNA sequencing. (B–D): Donor 1 was used for batch I of RNA sequencing. (B): Proliferation rate of single cell derived clones. (C): Clones were cultured as pellets (1–2 replicates) in chondrogenic medium (ChM) for 3 weeks and assessed by Safranin‐O/fast green (SafO/FG) staining. Underlined clone numbers correspond to the proliferation outliers. Scale bar: 200 μm. (D): Bern score was used to evaluate the SafO/FG stained sections. The red line indicates the threshold value to distinguish clones with high and low chondrogenic capacity (CC; c12: 3, c19: 6.25, c35: 8.5, c49: 9, c50: 3.25, c9: 8, c16: 1, c17: 0, c22: 1, c28:0, c44: 0, c26: 0.5, c34: 0, c48: 1.5). (E, F): Donors 2–4 were used for batch II of RNA sequencing. (E): Proliferation rate. (F): Bern score. The red line indicates the threshold value to distinguish clones with high and low chondrogenic capacity. The data presented excludes the remaining clones, which were not subjected to RNA sequencing.
