Figure 5.

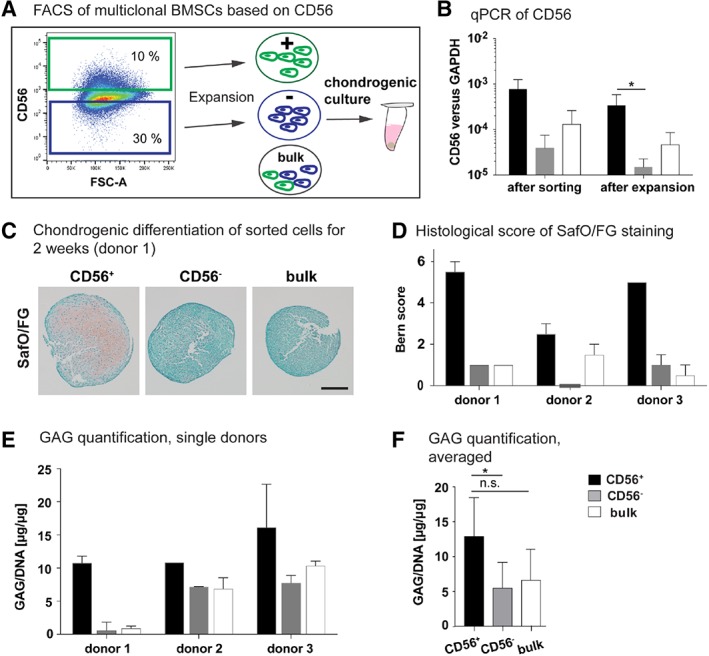
Correlation between CD56 and the chondrogenic capacity of multiclonal BMSCs. (A): P1‐expanded multiclonal bone marrow derived mesenchymal stromal cells (BMSCs) were sorted based on CD56 and after expansion subjected to 2 weeks culture in chondrogenic medium (ChM). (B): Gene expression of CD56 normalized to GAPDH of sorted cells directly after sorting (n = 3) and after 1 week expansion (n = 5). Unpaired t test; *, p‐value = .017. (C): Safranin‐O/fast green (SafO/FG) staining of paraffin sections of sorted cells after culture in ChM for 2 weeks as 3D pellets. Scale bar: 200 μm. (D): The SafO/FG stained sections were evaluated by Bern score. (E, F): The content of glycosamino glycan (GAG) of the pellets was quantified by DMMB assay and normalized to the DNA content. In (E), the separate values from each donor are shown and in (F) averaged values. One‐way ANOVA based on Kruskal–Wallis test and Dunn's multiple comparison test;*, p‐value = .024, n.s. not significant. n = 3, 1–2 replicates per cell population. Of note, donors 1–3 are different donors than used for the RNA sequencing.
