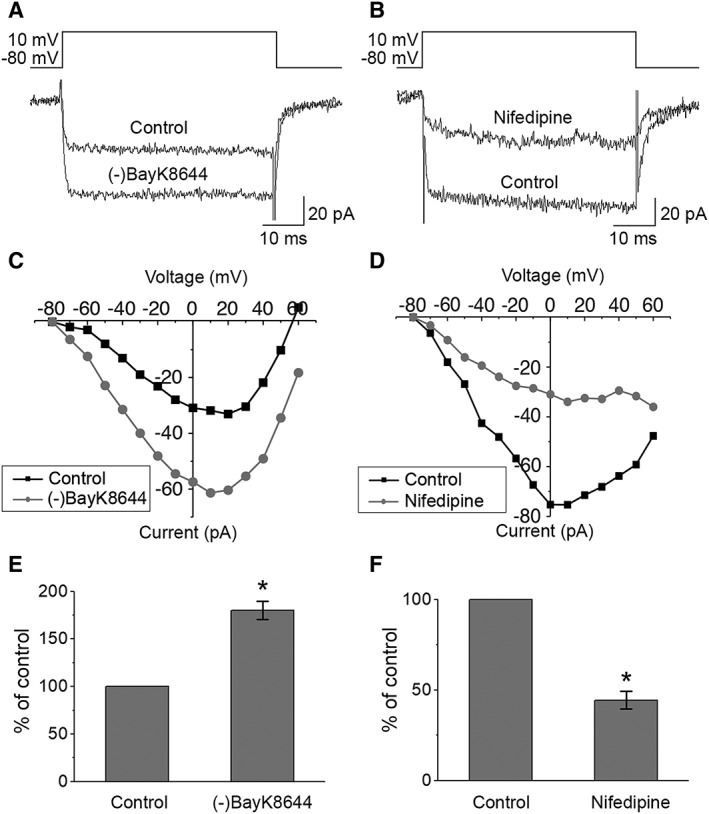
Figure 2.

Responses of the currents to Ca2+ channel modulators. Whole‐cell measurements of currents as responses to voltage pulses from −80 to +60 mV in 10 mV increments for 50 ms duration were performed before and after the application of the specific drugs. Examples of the effects of (A) L‐type Ca2+ channel activator 10 μM (‐)BayK8644 and (B) L‐type Ca2+ channel inhibitor 10 μM nifedipine on Ba2+ currents in hESC‐RPE and (C, D) the corresponding IV‐curves, respectively. Changes in maximum current amplitudes presented as percentages from control conditions (mean ± SEM) show that both (E) activation with (‐)BayK8644 (n = 3, cell line 08/017, days post‐confluence 73–74) and (F) inhibition with nifedipine (n = 4, cell line 08/017, days post‐confluence 73–99) resulted in statistically significant changes in the recorded currents. *Statistically significant difference with p < .05.
