Figure 4.

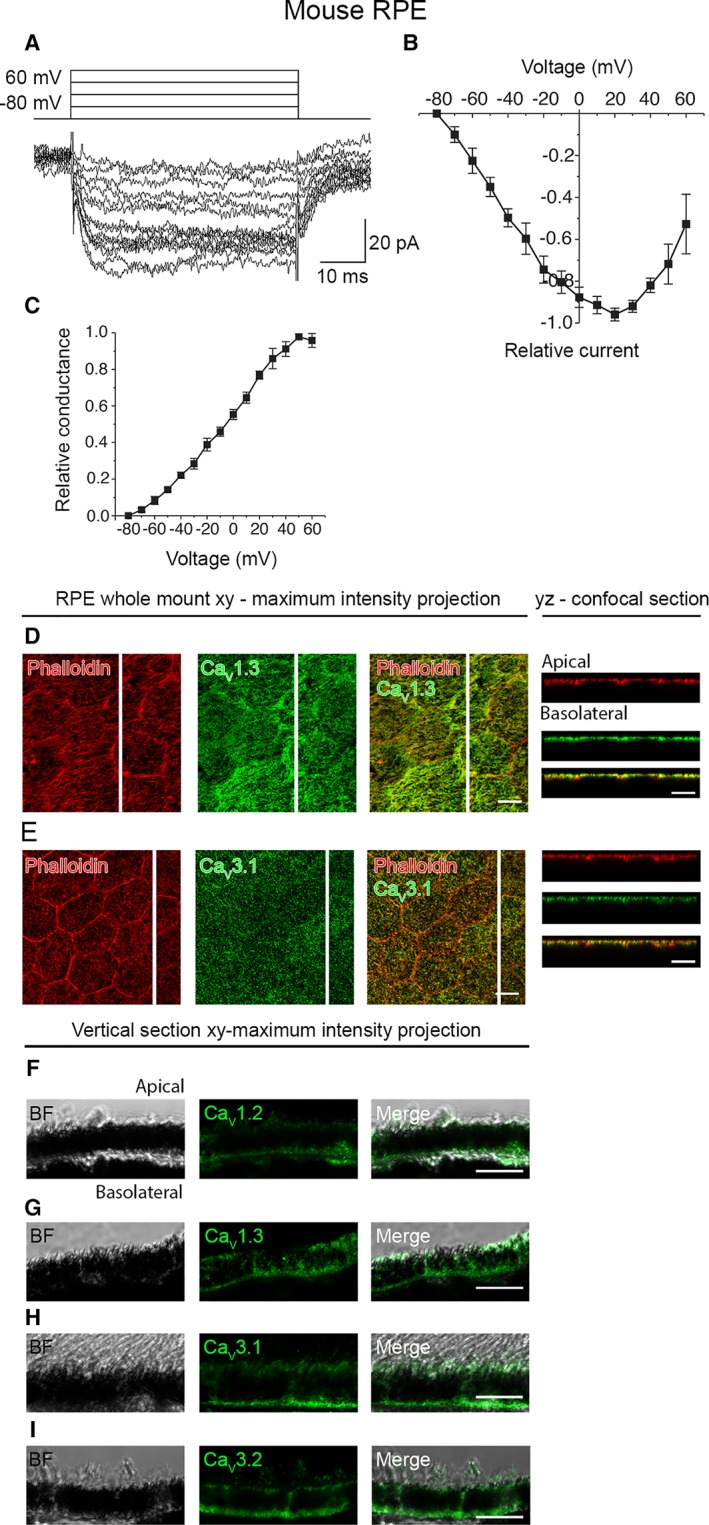
CaV channels in mouse RPE. (A): An example of the slowly inactivating L‐type current measured in whole‐cell configuration and elicited by 50 ms voltage steps from −80 to +60 mV in 10 mV increments. (B): Normalized and averaged IV‐curve of the L‐type current (mean ± SEM, n = 4). (C): Normalized and averaged GV‐curve of the L‐type current (mean ± SEM, n = 4). Localization of the CaV channels assessed by immunostainings of mouse RPE‐eyecup whole mount preparations. Confocal images show the xy‐maximum intensity projections and yz‐confocal sections of the samples (apical side upwards, localization of the section highlighted with a white bar). Actin cytoskeleton (phalloidin, red) together with (D) L‐type Ca2+ channel CaV1.3 (green), and (E) T‐type Ca2+ channel CaV3.1 (green). Immunostainings of paraffin embedded vertical sections of mouse eyecups shown as xy‐maximum intensity projections (apical side upwards). BF images together with L‐type Ca2+ channels (F) CaV1.2 (green) and (G) CaV1.3 (green), and T‐type Ca2+ channels (H) CaV3.1 (green) and (I) CaV3.2 (green). Scale bars 10 μm. Abbreviations: CaV, voltage‐gated Ca2+ channel; BF, bright‐field; RPE, retinal pigment epithelium.
