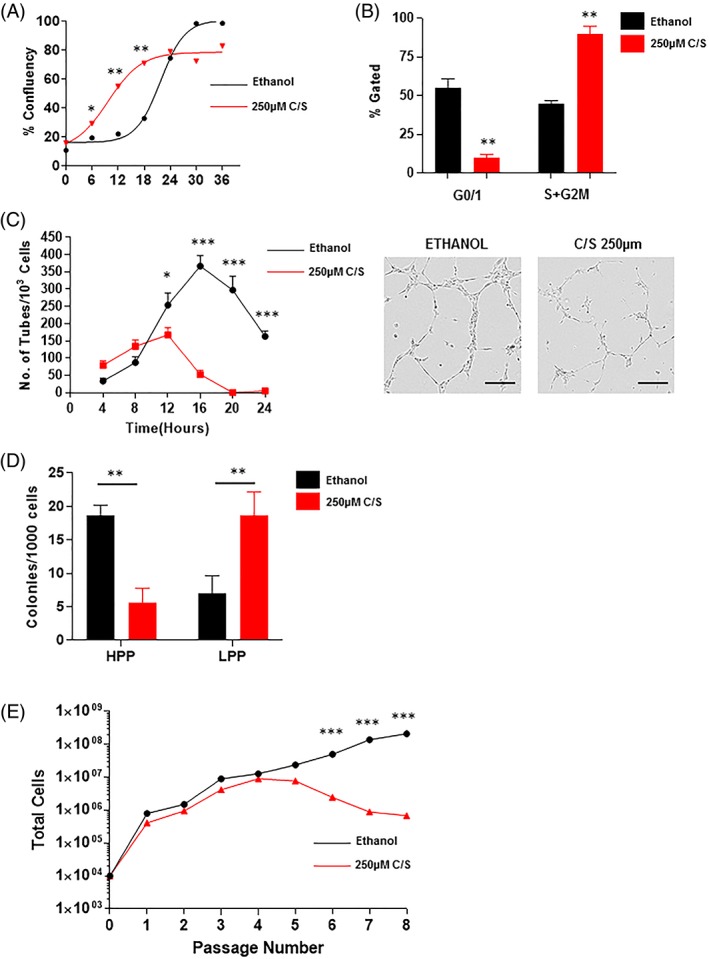
Figure 2.

(A): quantification of in vitro ECFC culture to reach confluency. Treatment of ECFC with C/S (red) significantly increase confluency rate compared to ethanol controls (black) (*p < .05; **p < .01). (B): assessment of cell cycle under flow cytometry showed significantly fewer ECFC in G0/1 phase and significantly more ECFC in S + G2M phase when treated with C/S (**p < .01). (C): quantification of tube formation in Matrigel with or without C/S (*p < .05; ***p < .001). (D): quantification of HPP colonies and LPP ECFC colonies with or without C/S (**p < .01). (E): assessment of long‐term passaging of ECFC with or without C/S (***p < .001). All error bars represented as standard deviation. Abbreviations: C/S, cyclosporine; ECFC, endothelial colony forming cells; HPP, high‐proliferative potential; LPP, low‐proliferative potential.
