Figure 4.

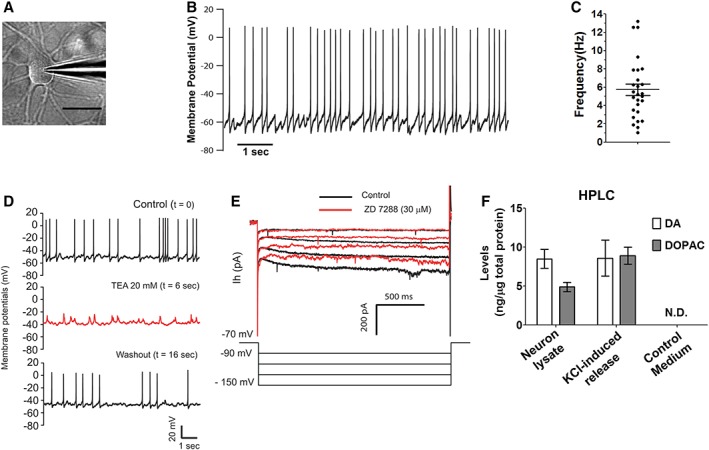
Functional characterization of mRNA‐induced midbrain dopaminergic (miDA) neurons. (A): Differential interference contrast optics image of a patched miDA neuron (scale bar: 20 μm). (B, C): miDA neurons derived from iPSC1 cells showed spontaneous spiking activity. This cell has a resting membrane potential of −60 mV (B). The spontaneous spiking frequencies from 27 miDA neurons were plotted with mean ± SEM marked inside (C). (D): Spontaneous spiking of miDA neurons was blocked by tetraethylammonium (TEA) and returned when TEA was washed away (n = 6). (E): Hyperpolaring the membrane potential of miDA neurons from −90 to −150 mV produced an outward cation current, which was blocked by ZD 7288 (30 μM, n = 4). (F): High‐performance liquid chromatography (HPLC) quantification of DA and its metabolite 3,4‐dihydroxyphenylacetic acid (DOPAC) released from miDA neurons (differentiation day 50) in response to KCl‐evoked depolarization for 15 minutes. Data represents mean ± SEM (n = 2, N.D.: not detected).
