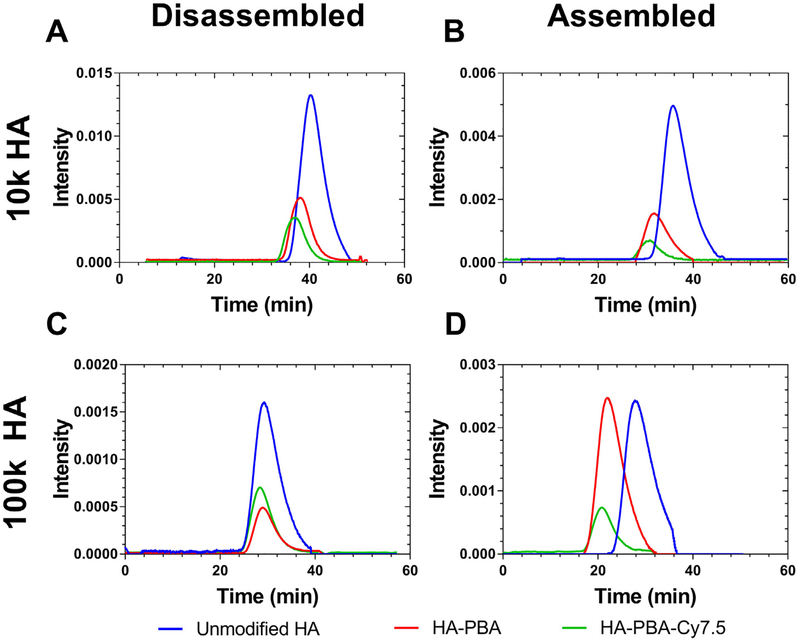
Fig. 2.
Size-exclusion chromatography of HA and HA conjugates reported as dRI spectra. Samples of HA, HA-PBA, and HA-PBA-Cy7.5 were prepared using either 10 kDa HA (A,B) or 100 kDa HA (C, D) and prepared in aqueous buffer (B, D) or 50:50 aqueous buffer DMSO (“disassembly buffer,” A, C). (A) shows the difference between disassembled HA conjugates, comparing the difference in size between the three samples of 10 kDa HA. When compared to (B), which demonstrates the SEC profile of assembled conjugates, the samples appear slightly larger due to associations between polymer strands forming self-assembled nanoparticles. The same trend is observed for the 100 kDa HA samples, in which the assembled (D) samples are slightly larger than the disassembled (C) samples.

