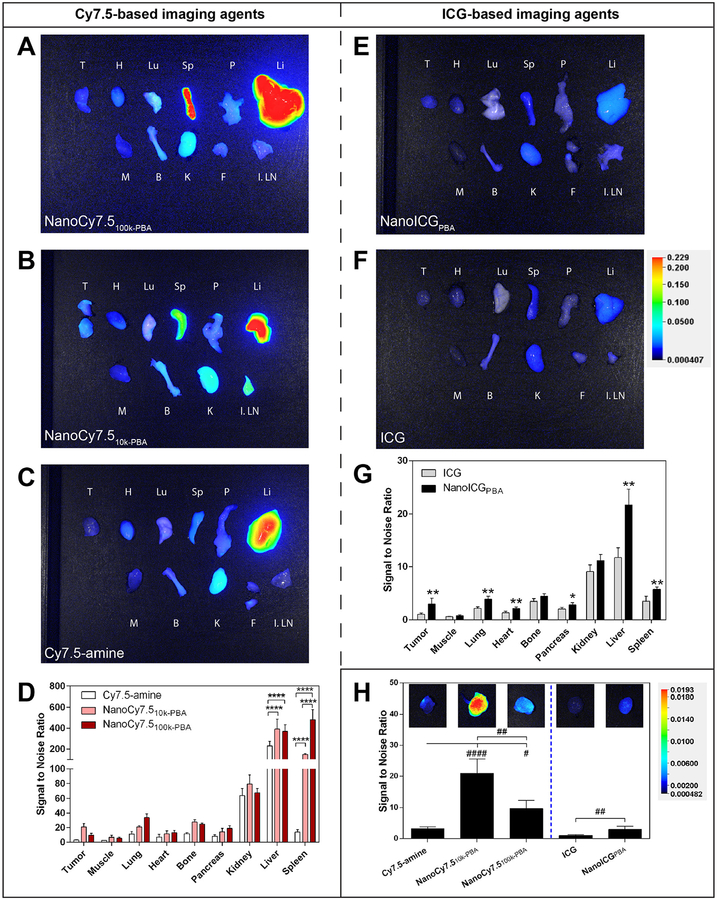
Fig. 3.
Biodistribution of contrast agents after administration in PC3 tumor-bearing nude mice. (A-C) Representative NIR fluorescence images of ex vivo organs harvested 24 h after intravenous administration of indicated contrast agent (1.2 nmol [984 ng] of Cy7.5/mouse for Cy7.5-amine, NanoCy7.510k-PBA, or NanoCy7.5100k-PBA). All images are the “800 nm” channel overlaid onto the brightfield photograph from the Pearl Trilogy imaging system. Organ labels: T, tumor(s); H, heart; Lu, Lung; Sp, spleen; P, pancreas; Li, liver; M, muscle (i.e. quadriceps femoris muscle); B, bone (i.e. femur); K, kidney; F, fatty tissue adjacent to tumor with potential lymph; I. LN, inguinal lymph node with skin attached. (D) Quantitative summary of fluorescence intensity of organs collected 24 h after intravenous administration of the NanoCy7.5 conjugates and Cy7.5-amine control, where bars represent the average pixel signal-to-noise ratio (SNR; mean ± s.d) of N = 4 mice, with some tumors having two parts. ****p < 0.0001, two-way ANOVA with Tukey’s multiple comparisons test. (E, F) Representative NIR fluorescence images of ex vivo organs harvested 24 h after intravenous administration of indicated contrast agent (10 nmol [7.75 μg] of ICG/mouse for ICG and NanoICGPBA). (G) Quantitative summary of fluorescence intensity in the NanoICGPBA and ICG control groups, where bars represent the average pixel SNR (mean ± SD) of N = 3 mice for ICG and N = 4 mice for NanoICGPBA, with some tumors having two parts. *p < 0.05, **p < 0.01, unpaired t-test. (H) The tumor SNR is shown with representative NIR fluorescence pictures of tumors scaled to the same level to better visualize the differences between groups, #p < 0.05, ##p < 0.01, ####p < 0.0001, one-way ANOVA with Tukey’s multiple comparisons test for Cy7.5 groups, and ##p < 0.01 Mann-Whitney test for ICG groups.

