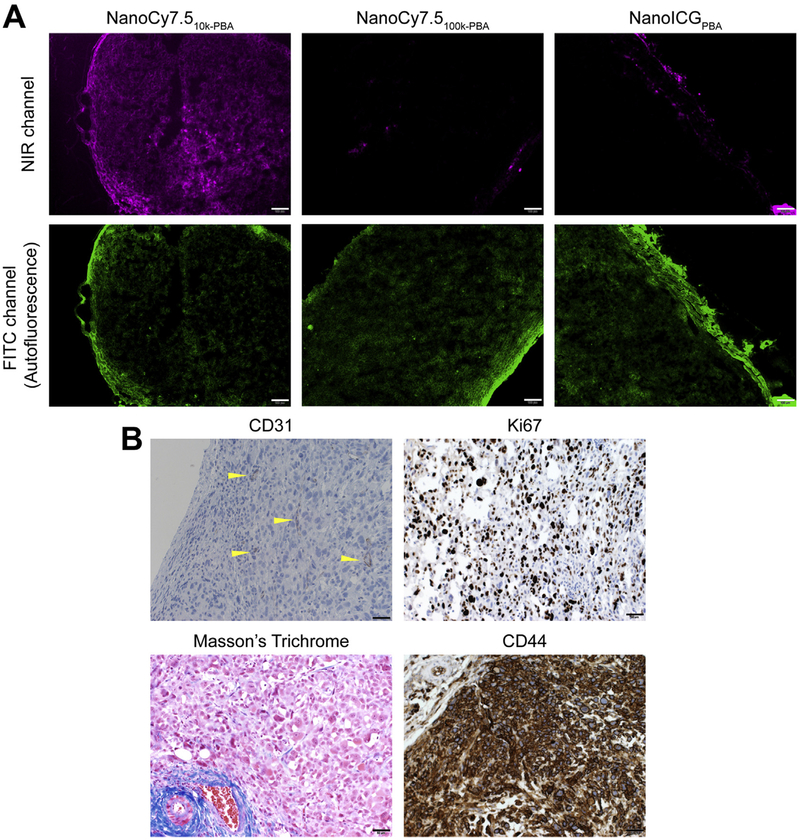
Fig. 6.
NIR dye distribution in tumors. (A) Representative fluorescence micrographs of tumors in the NIR channel after frozen sectioning for indicated NIR nanoparticles. Scale bar = 100 μm. (B) Representative tumor sections were stained with indicated dye (Masson’s trichrome) or antibody (anti-mCD31, endothelial marker; anti-hKi67, proliferation marker; and anti-hCD44, a cell surface receptor for HA). Sections stained with antibodies (shown in brown) were counterstained with hematoxylin (shown in blue). CD31-positive vessels are marked with yellow arrowheads. Scale bar = 50 μm. (For interpretation of the references to colour in this figure legend, the reader is referred to the web version of this article.)

