
Fig. 4. Relationships between thematic performance and thickness in ATL ROI.
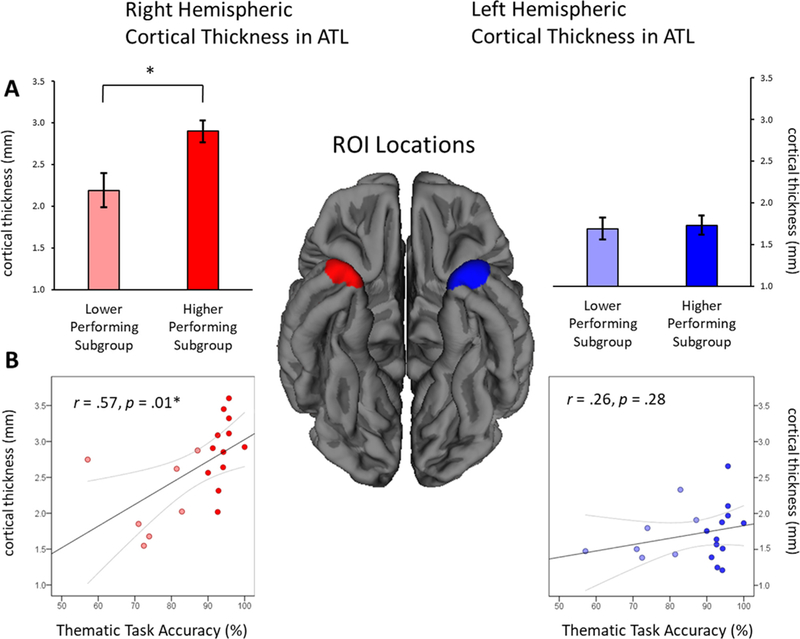
Locations of the ATL ROI in each hemisphere are shown at center. (A) Average cortical thickness in each ROI is shown for subgroups of PPA-S patients performing lower and higher on the thematic verification task. (B) Correlation scatterplots between ROI thickness and accuracy of thematic verification, with each dot representing values from a single PPA-S participant. ROI = region of interest. *: Statistically significant (p < .05).