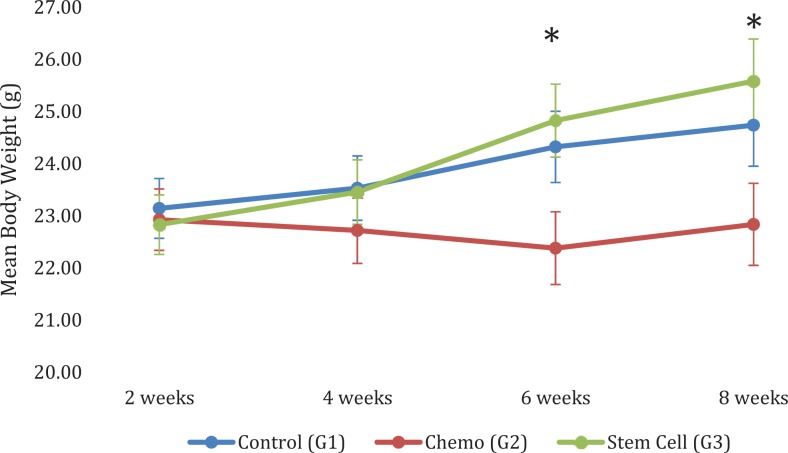
Figure 2.
Mean body weight by group and time. Group 2, the trend was such that body weight remained relatively constant over time posttreatment. Group 3, significant increases in body weight of 1.99 g from 2 to 6 weeks (P < .0001), 2.75 g from 2 to 8 weeks (P < .0001), 1.37 g from 4 to 6 weeks (P = .0005), and 2.13 g from 4 to 8 weeks (P < .0001). At 6- and 8-week time points, group 3 had significantly higher mean body weight than group 2 (P < .0001). N = 6 at 2 weeks, N = 5 at 4 weeks, N = 4 at 6 weeks, and N = 3 at 8 weeks for each group.

