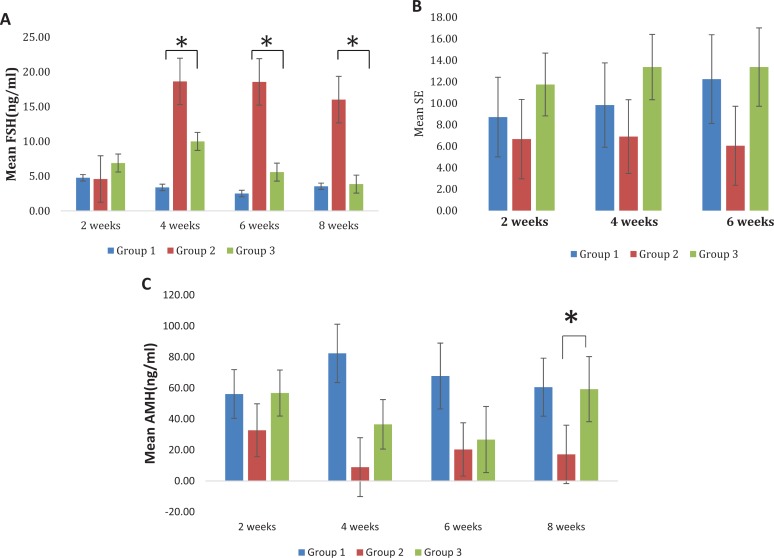
Figure 4.
A, Mean follicle-stimulating hormone (FSH) levels by group. At 4, 6, and 8 weeks posttreatment, group 3 had significantly lower FSH than group 2 (P = .0338, .0165, and .0034), respectively. B, Mean serum estradiol by group. Group 3 had higher mean serum estradiol than group 2 at 4 weeks (P = .0066) and at 6 weeks (P = .0064). C, Mean anti-Müllerian hormone (AMH) by group. At 4-week time point group 1 had significantly higher AMH than the group 2 (P < .0001) and group 3 (P = .0005). At 8 weeks posttreatment, and groups 1 and 3 had significantly higher AMH than group 2 (P = .0042), and the groups 1 and 3 did not have significantly different AMH levels (P = .9287). Within group 2, there were no significant differences in AMH over time (all P > .05).

