Figure 5.
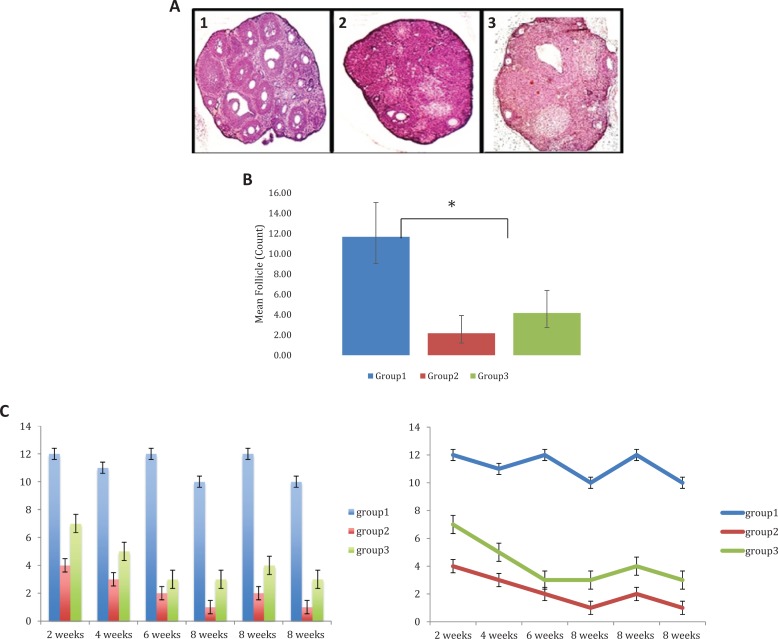
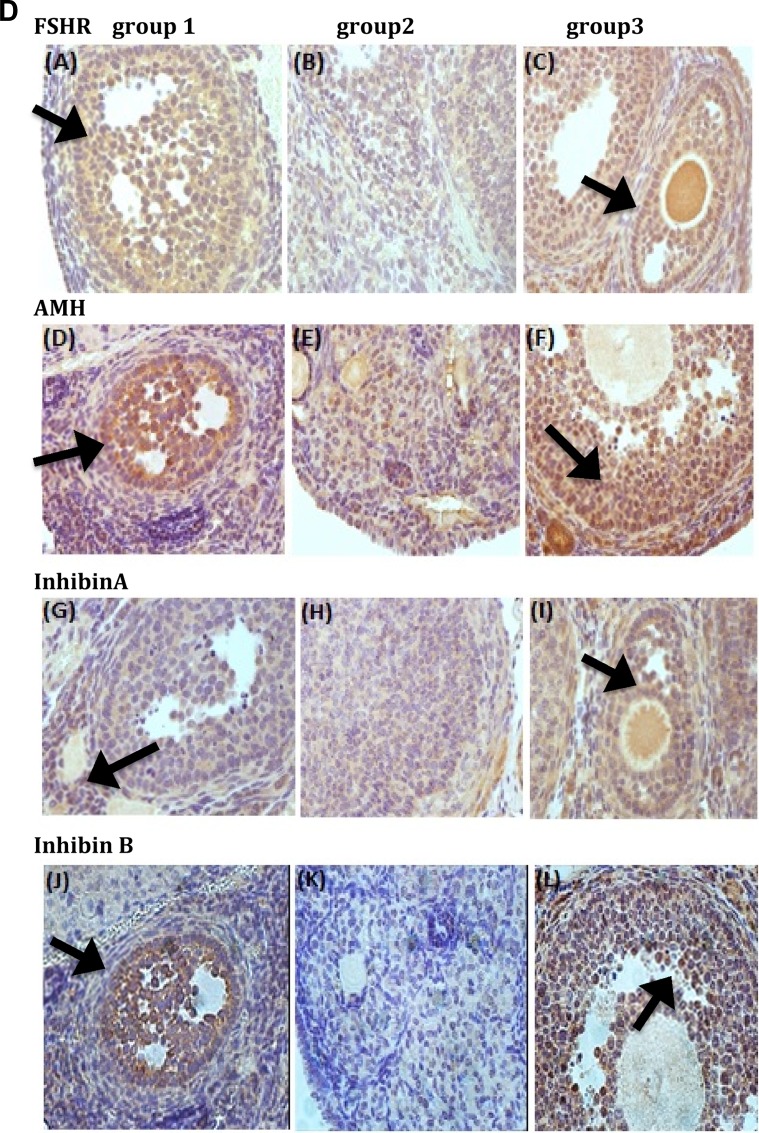
A, Hematoxylin and eosin staining of the ovarian tissues ×10. Hematoxylin and eosin staining of the ovarian tissue at 4-week timepoint. A1, Group 1 represents normal ovarian tissue. A2, Group 2 had an overall reduction in ovary size and failed to develop antral follicles. A3, Group 3 showed an increase in the number of follicles over time. B, Mean follicle count by group. Mean follicle count differs among groups (P < .0001). The mean follicle count in group 1 was 5.4 times larger than group 2 and 1.8 times larger than group 3. The mean follicle count in group 3 was 1.92 times greater than group 2; however, this difference was not statistically significant. C, Follicle count over time by group. Same data from 5A2 illustrating follicular densities (the fifth cut section for the ovary) for each animal at each time point. N = 1 at time point 2, 4, and 6 weeks; N = 3 at 8-week time point. D, Follicle-stimulating hormone receptor (FSHR) expression in recipient mouse ovaries. (A) FSHR were detected in group 1. (B) FSHR was not detected in recipient ovaries of group 2 (without stem cells). (C) FSHR were detected in recipient ovaries of group 3 two months after stem cells injection. Scale bars = 40 μm. anti-Müllerian hormone (AMH) expression in recipient mouse ovaries. (D) AMH was expressed in all granulosa cells of primary, preantral, and small antral follicles in normal ovaries. (E) AMH expression disappeared in stromal and atretic follicles in recipients’ ovaries without stem cells injection 2 months after chemotherapy. (F) AMH expression patterns are strong in recipient ovaries 2 months after stem cells injection; data are consistent with that from control normal ovaries. Scale bars = 40 μm. Inhibin A expression in recipient mouse ovaries. (G) Inhibin A was detected in group 1 (control). (H) Inhibin A was not detected in recipient ovaries of group 2 (without stem cells). (I) Inhibin A was detected in recipient ovaries of group 3 two months after stem cells injection. Scale bars = 40 μm. Inhibin B expression in recipient mouse ovaries (J) Inhibin B was detected in group 1(control). (K) Inhibin B was not detected in recipient ovaries of group 2 (without stem cells). (L) Inhibin B was detected in recipient ovaries of group 3 two months after stem cells injection. Scale bars = 40 μm.


