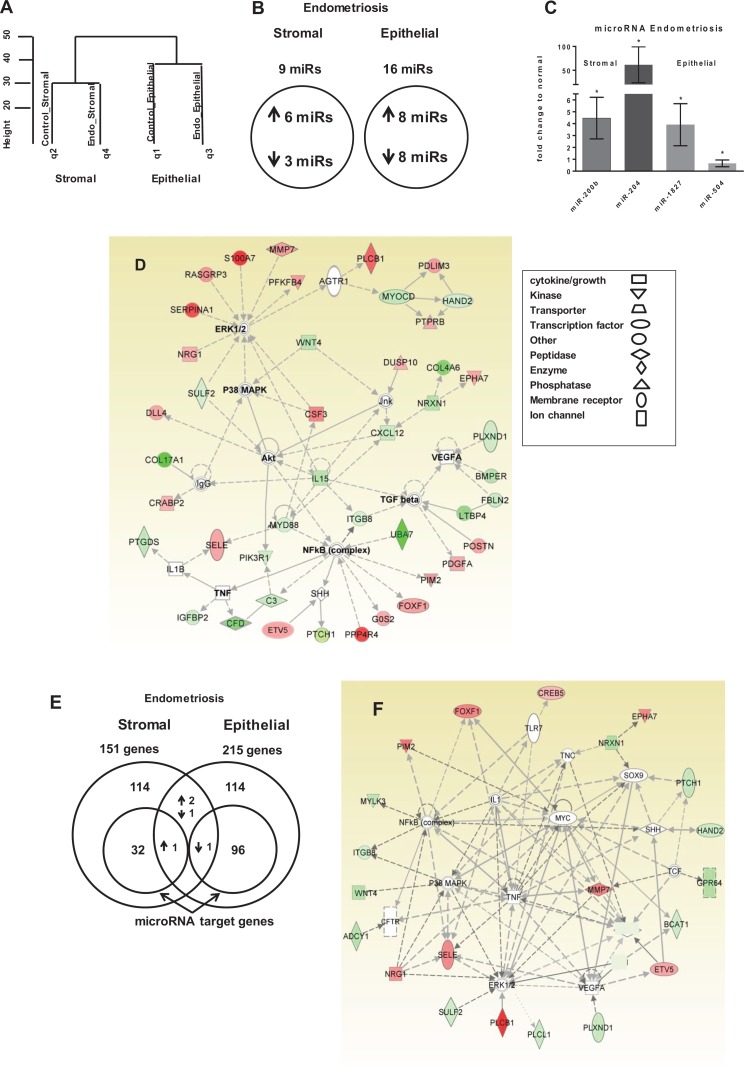
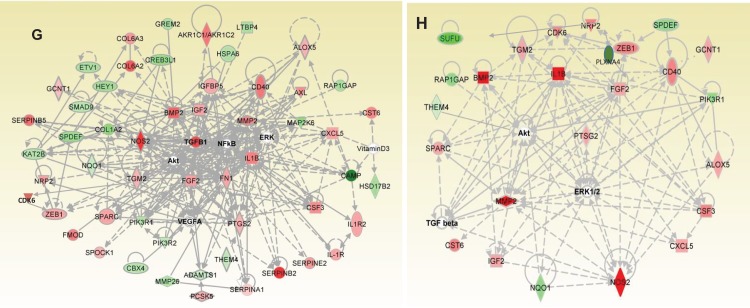
Figure 3.
A, Dendrogram of hierarchical clustering analysis of microRNA data from microRNA microarray, q1 to q4 are sample queries. B, Venn diagram of microRNA expression from microRNA microarray of endometriotic stromal and epithelial cells; selection by >1.5-fold change, P ≤ .05. C, MicroRNAs from microRNA microarray of endometriotic stromal (n = 3) and epithelial cells (n = 6) validated by quantitative polymerase chain reaction (qPCR), normalized with SNORD44. D, Ingenuity pathway analysis (IPA) of Akt/ERK/P38MAPK/TNF/NF-κB network of endometriotic stromal messenger RNA (mRNA). E, Venn diagram of mRNA expression from RNA-Seq of endometriotic stromal and epithelial genes with subsets of predicted microRNA target genes. F, The IPA analysis of microRNA predicted target gene network in endometriotic stromal cells. G, The IPA analysis of mRNA transforming growth factor β1 (TGFβ1)/interleukin 1B (IL-1B) network in endometriotic epithelial cells. H, The IPA analysis of microRNA predicted target gene network in endometriotic epithelial cells. Shaded genes are statistically significant. Shading intensity of a gene corresponds with the degree of up- or downregulation in endometriosis. Red-colored genes are upregulated in endometriosis and green-colored genes are downregulated. Mean (standard deviation). *P ≤ .05.


