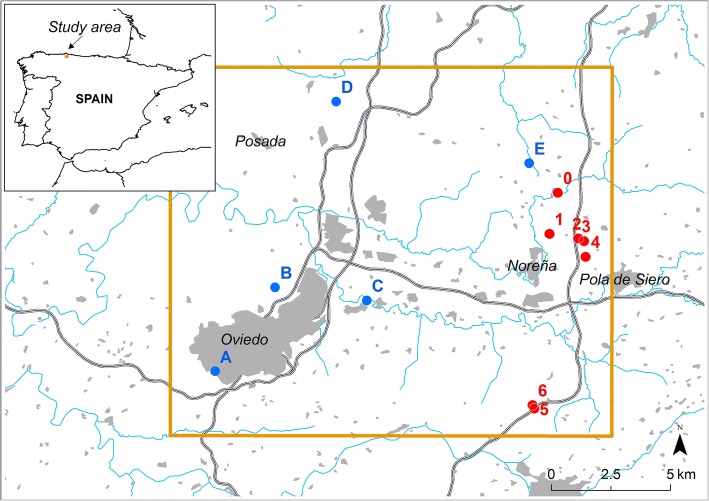
Fig. 3.
Location of the study area in NE Spain and places cited in the detection process of Aedes japonicus. In red, field sampled locations where 0 is the initial point from Fig. 2a. In blue, citizen science reports not field sampled. Greyed sections are urban areas, rivers are shown in blue, and highways are displayed as double-lined paths. Map background data: BCN200 2014-2015 CC-BY 4.0 ign.es, BDLJE 2015 CC-BY 4.0 ign.es and World Administrative Divisions. Esri, DeLorme Publishing Company, Inc

