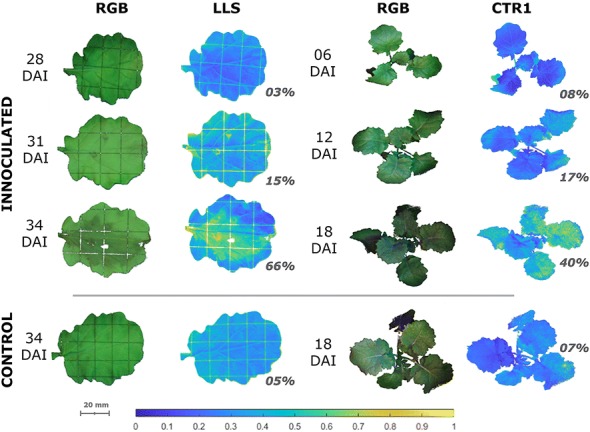
Fig. 3.

Infection Detection. Pathogen ingress detection demonstrated using the LLS for leaf and CTR1 for plant to outline disease severity, shown as a percentage, and distribution across a representative subset of the trial dates. The SVI colormap is normalised between 0 and 1 to display the infection intensity and distribution. The spatial scale is 1:25 with the 10 mm grid shown
