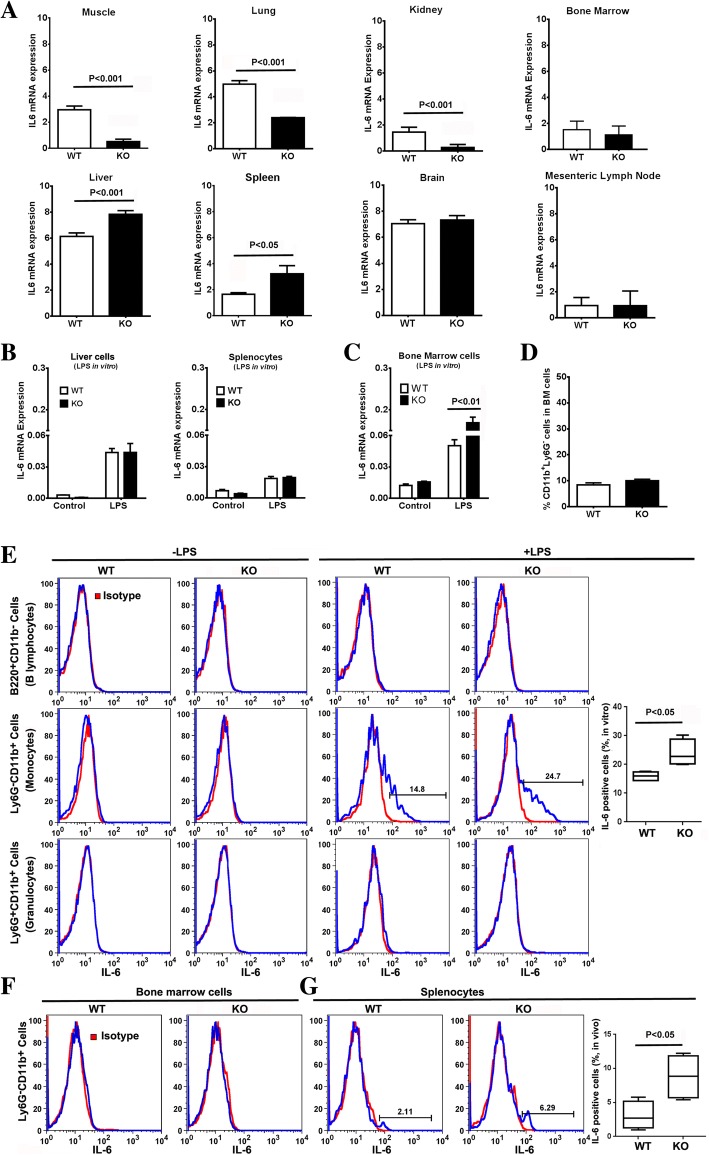
Fig. 3.
IL-6 expression levels of organs in Ceacam1−/− mice in response to LPS challenge. (a) IL-6 mRNA expression levels of mouse organs after i.p. injection of LPS (10 mg/kg) for 2 h (n = 4). (B) IL-6 mRNA expression level in PBS perfused liver and splenocytes after treated with 500 ng/mL LPS for 2 h in vitro (n = 3). (c) IL-6 mRNA expression level in bone marrow cells after treated with 500 ng/mL LPS for 2 h in vitro (n = 3). (d) Percentage of bone marrow CD11b+Ly6G− cells in WT and Ceacam1−/− mice (n = 4). (e) Intracellular staining of IL-6 in bone marrow cells after treated with Brefeldin A (BFA) plus 500 ng/mL LPS for 5 h in vitro (n = 3). (f) Intracellular staining of IL-6 of bone marrow cells after i.p. injection of BFA plus LPS (10 mg/kg) for 5 h in vivo (n = 3). (g) Intracellular staining of IL-6 of splenocytes after i.p. injection of BFA plus LPS (10 mg/kg) for 5 h in vivo (n = 3)

