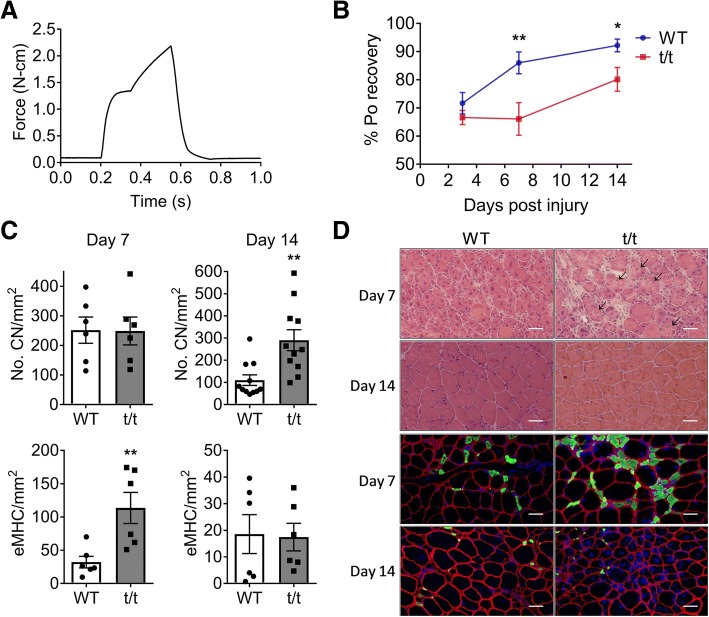
Fig. 6.
Impaired functional recovery and muscle regenerative capacity after injury. a Representative Po graph during eccentric muscle contraction (ECC). b Po recovery at 3, 7, and 14 days after ECC injury. c Numbers of CN (top) and eMHC+ fibers (bottom) were counted on injured LG at 7 (left) and 14 days (right) post-injury and compared between t/t and WT groups. d Cross-sectioned images of injured LG stained by H&E (top) and immunostained with antibodies (eMHC; green, dystrophin; red, and DAPI; blue, bottom). Scale bar:50 μm. Arrowhead indicates necrotic fiber. Number of muscle samples = 3 in each group. **P < 0.01 vs. t/t; *P < 0.05 vs. day 3

