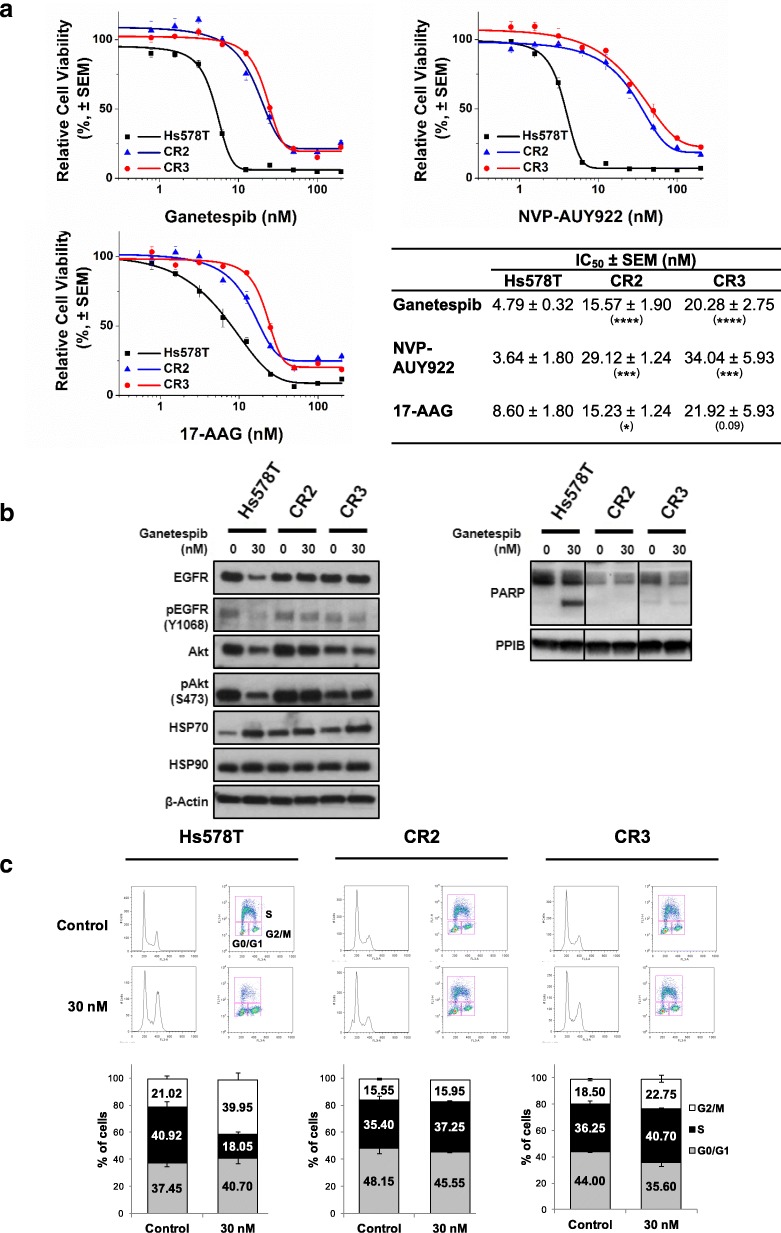
Fig. 2.
Resistance to HSP90i in CR2 and CR3. a Cross-resistance to HSP90i. Hs578T, CR2 and CR3 cells were treated with increasing concentrations of either ganetespib, NVP-AUY922 or 17-AAG for 72 h and subjected to resazurin-based cell viability assay. Cell viability (%) for each treatment was expressed relative to the DMSO-treated control. Representative graph from at least three independent experiments each performed in triplicate and error bars indicate SEM. The table represents the IC50 values of compounds in the cell lines. The IC50 values in respective clones were compared with the values in the parental Hs578T cells. *, *** and **** indicate p-value ≤0.05, ≤0.001 and ≤ 0.0001 respectively; by Student’s t-test. b Absence of downregulated expression of HSP90 client protein and induction of apoptosis. Hs578T, CR2 and CR3 cells were treated with 30 nM ganetespib for 24 h. Lysates were subjected to western blotting analysis and blotted with indicated antibodies. Level of cleaved PARP was also determined to assess apoptosis. PPIB and β-actin were used as loading controls. Representative images from two experiments are shown. c G2/M cell cycle arrest observed in parental Hs578T cells only. Hs578T, CR2 and CR3 cells were treated with 30 nM ganetespib for 24 h and pulse labelled with BrdU for 20 min. Cells were stained with propidium iodide and anti-BrdU antibody before analysed by flow cytometry. The top images represent the cell population with BrdU staining and PI staining, which consist of G0/G1- (bottom left), G2/M- (bottom right) and S-phase. The graph represents the mean percentage of cells in each phase of cell cycle from two independent experiments. Error bars indicate SEM

