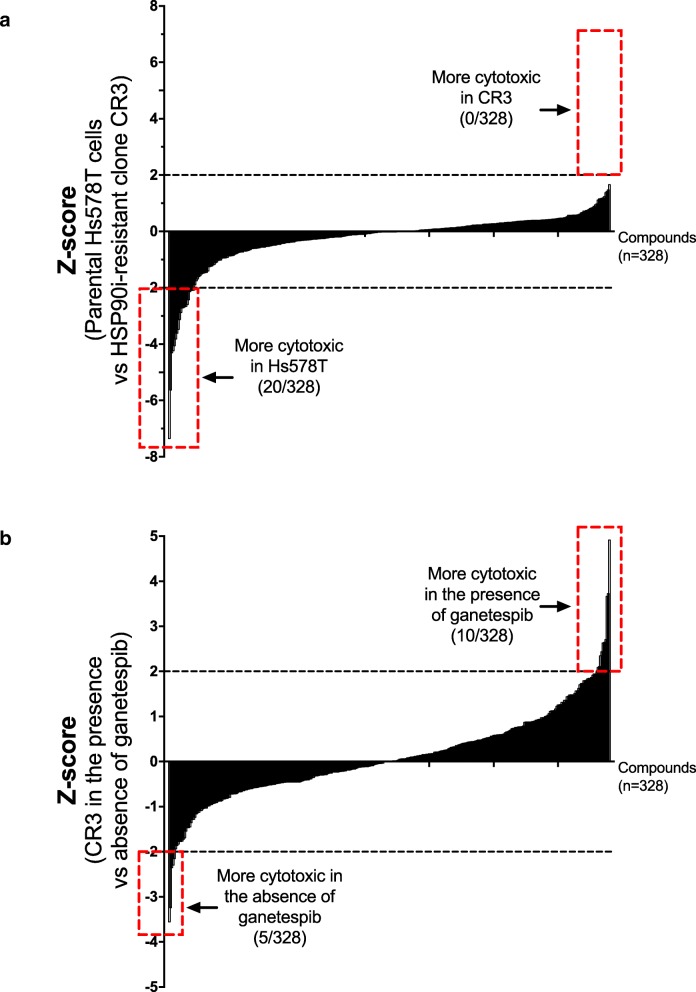
Fig. 5.
Differential sensitivity to compounds in parental Hs578T cells and HSP90i-resistant clone CR3. a Comparison between parental Hs578T cells and CR3. A screen with a 328-compound bioactive small molecule library was performed on the parental Hs578T cells and HSP90i-resistant clone CR3. The scatter plot represents the Z-scores comparing the sensitivity for individual compounds in Hs578T and CR3 cells. The Z-scores were ranked from compound that was least sensitive to most sensitive in CR3 when compared with Hs578T cells. Z-score ≥ 2 represents compounds that were selectively cytotoxic to CR3 compared with Hs578T cells while Z-score ≤ − 2 represents compounds that were selectively cytotoxic to Hs578T cells compared with CR3. b Comparison between the presence and absence of ganetespib in CR3. The screen on CR3 was also performed in the presence of ganetespib. The scatter plot represents the Z-scores comparing the sensitivity for individual compounds in CR3, in the presence and absence of ganetespib. The Z-scores were ranked from compound that was least sensitive to most sensitive in CR3, in the presence of ganetespib. Z-score ≥ 2 represents compounds that were selectively cytotoxic to CR3 in the presence of ganetespib while Z-score ≤ − 2 represents compounds that were selectively cytotoxic to CR3 in the absence of ganetespib

