Fig. 1.

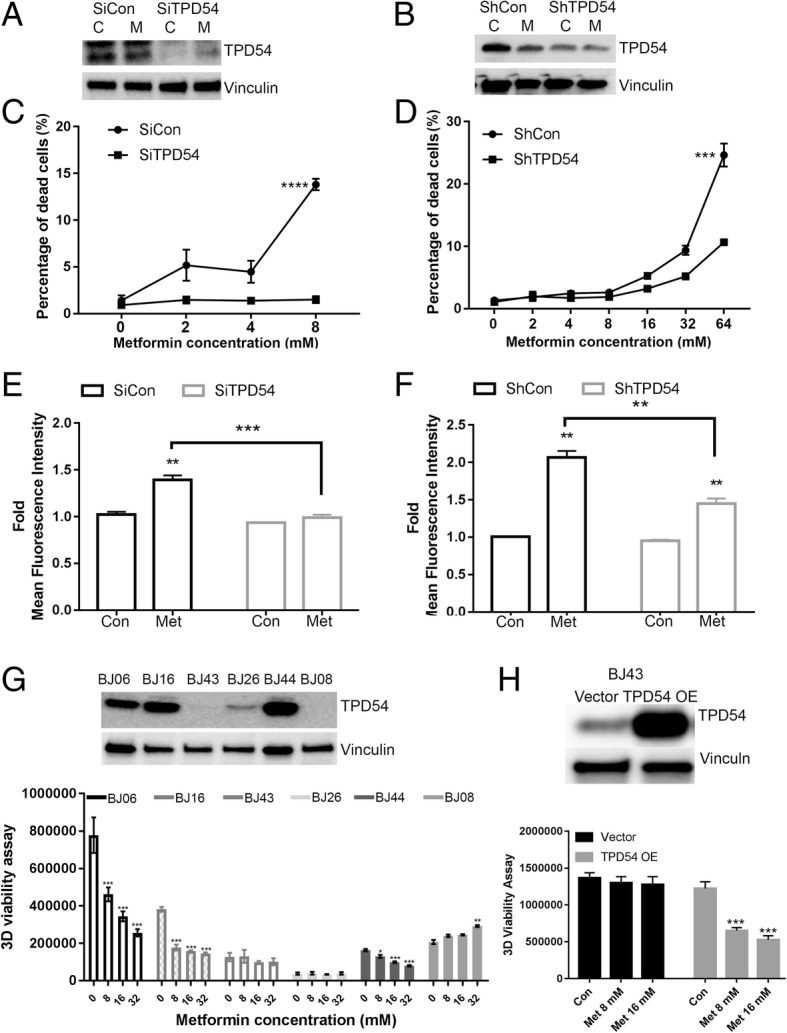
TPD54 affects cellular sensitivity to metformin treatment accompanied by altered ROS production in MCF7 cells and breast cancer patient-derived xenografts. a TPD54 protein level was detected by western blot in control and TPD54 transiently knocked down cells treated with or without 8-mM metformin for 2 days. C: 1× PBS, M: metformin b TPD54 protein level was detected by western blot in control and TPD54 stably knocked down MCF-7 cells treated with or without 8-mM metformin for 2 days. C: 1× PBS, M: metformin. c Percentage of dead cells was plotted in cells transfected with control and TPD54 siRNAs and treated with metformin at indicated concentrations for 2 days. d Percentage of dead cells was plotted in control and TPD54 stably knocked down cells treated with metformin at the indicated concentrations for 2 days. e Fold changes of Mitosox mean fluorescence intensity representing mitochondrial ROS production was quantified in cells described in c. f The same assays and quantifications were performed in cells described in d. g Western blot analysis was performed using lysates from different breast cancer xenospheroids to detect TPD54. 3D cell viability was measured for xenospheroids treated with metformin at the following concentrations for 5 days: 8, 16, and 32 mM metformin. h TPD54 was overexpressed in BJ43 and treated with metformin as indicated for 3 days. 3D viability was performed. All data presented are representative experimental data that have been replicated by independent experiments and are reported as the mean ± SD from triplicate data of one experiment. Values are presented as mean ± SD, student t test was used to calculate p value for two-group comparisons with ****p < 0.0001, ***p < 0.001, **p < 0.01, *p < 0.05)
