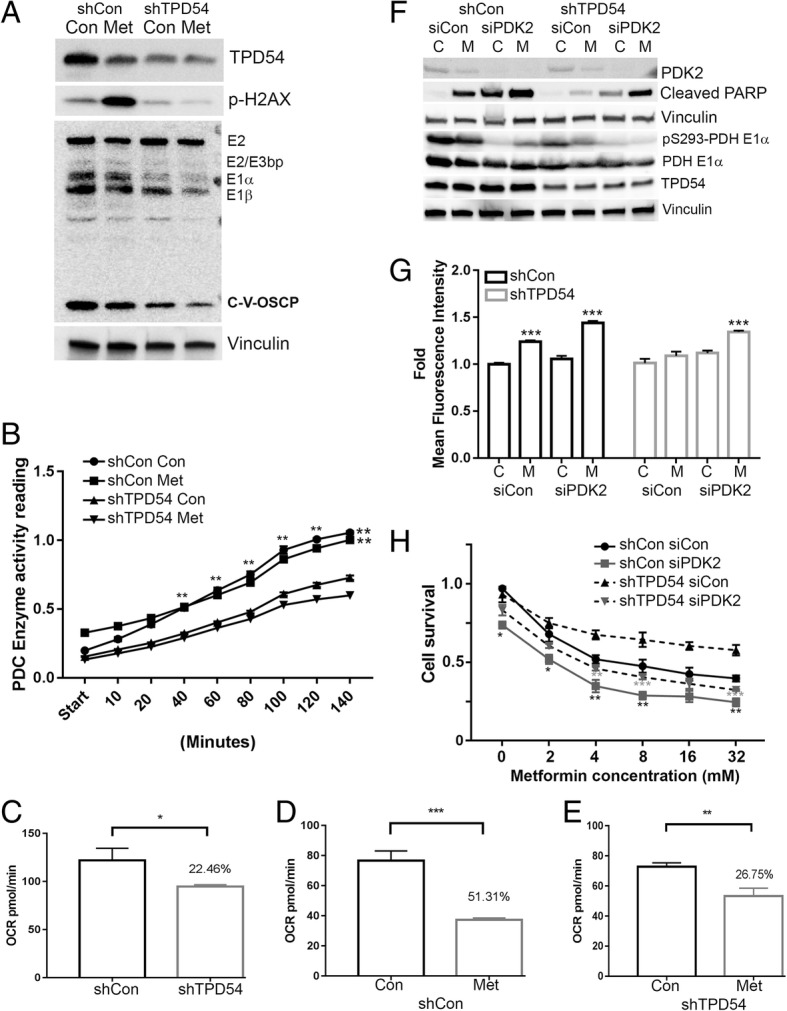
Fig. 3.

TPD54 is positively correlated with PDHE1 α protein and PDH complex enzyme activity, and through it changes the sensitivity of cells to metformin. a TPD54, p-H2AX, and PDH complex were detected by western blot in control and TPD54 stably knocked down cells treated with or without 8-mM metformin for 2 days. b PDH complex (PDC) enzyme activity was measured using cell lysates from cells described in a. shCon vs. shTPD54 with p < 0.01 c–e Oxygen consumption rate was measured using a Seahorse XFp analyzer for control and TPD54 stably knocked down cells (c), in control cells treated with or without 8-mM metformin (d), and in TPD54 stable knockdown cells treated with 1× PBS or 8 mM metformin (e). f Control and TPD54 stably knocked down cells transfected with either control siRNA or siPDK2 were treated with or without metformin for 2 days. Western blot assays for indicated proteins were performed. g Fold change of MitoSox mean fluorescence intensity was measured in control and TPD54 stably knocked down cells treated with 8-mM metformin for 2 days after knocking down PDK2.Sicon C vs. siCon M with p < 0.001, siPDK2 C vs. siPDK2 M with p < 0.001 in control cells. SiPDK2 C vs. siPDK2 M with p < 0.001 in TPD54 knocked down cells. h Cells were transfected with control, siPDK2, shTPD54 or siPDK2, and shTPD54 together. Cell survival was determined in the presence of the indicated metformin concentrations. shCon siCon vs. shCon siPDK2 or shTPD54 Con vs. shTPD54 siPDK2 were compared as indicated at different concentrations of metformin treatment. All data presented were representative experimental data that has been replicated by independent experiments. Data are reported as the mean ± SD from triplicate data of one experiment. Values are presented as mean ± SD, student t test was used to calculate p value for two-group comparisons with ***p < 0.001, **p < 0.01, *p < 0.05)
