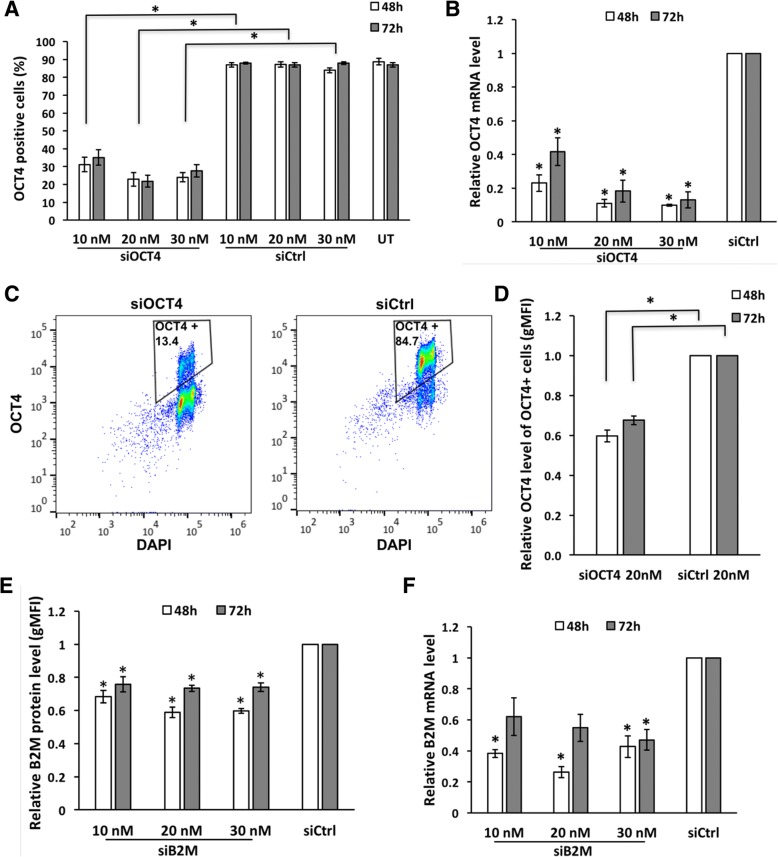
Fig. 3.
siOCT4 and siB2M silence targeted gene. a Flow cytometric analysis of OCT4 expression in cells treated with various concentrations of siOCT4 or siCtrl complexes with PF14, analyzed at 48 h and 72 h. b RT-qPCR analysis of OCT4 mRNA level after silencing with siOCT4. c Representative dot blot of flow cytometric analysis illustrating lower proportion of OCT4-positive cells at 72 h in sample treated with 20 nM siOCT4. d Flow cytometric analysis of OCT4 protein level (estimated based on gMFI change) in OCT4-positive cells at 48 h and 72 h. e Flow cytometric analysis of B2M protein level (estimated based on gMFI change) after treatment with siB2M. f RT-qPCR analysis of B2M mRNA level after treatment with siB2M. All values on graphs (b, e, and f) are represented relative to siCtrl sample with identical concentration. Statistical significance with P values less than 0.05 are labeled as * (mean ± SEM, N = 3). Abbreviations: UT, untreated

