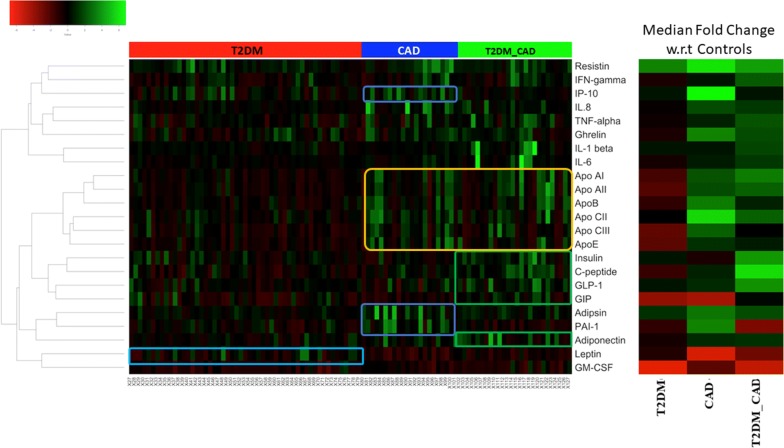
Fig. 1.
Heatmap showing the fold change of the various clinically significant markers across all the individuals belonging to the three different disease states. In order to obtain the fold change, the median values of each clinical marker was obtained across all the healthy controls (referred to as the ‘control median’). The fold change of a given marker for a given patient was then obtained as the log-ratio of the value of the marker in that patient divided by the control-median corresponding to that marker. Four distinct sets of correlated protein markers (CLs) are highlighted by dark blue, light blue, yellow and green boxes on heatmap. The median fold change in each disease cohort versus the control medians of each marker is also shown

